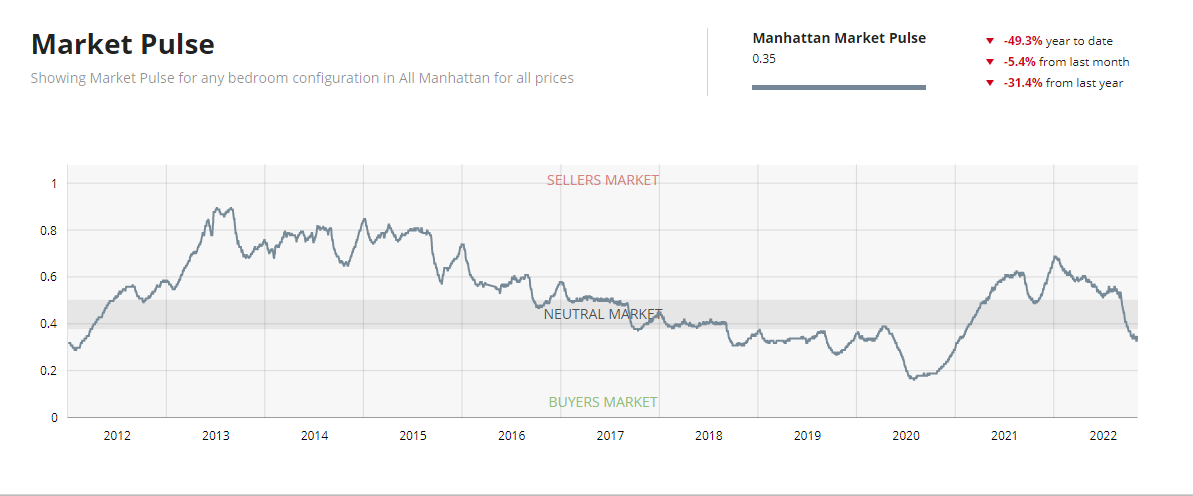
The Manhattan Market Report for the week ending November 4th shows a slowing market that matches the 2020 and 2019 vintage 4th quarters. Supply closed out at 7,569 and Pending Sales at 2,602, maintaining the market pulse in buyer leverage territory at .34%
As we began the month of November, Stocks tumbled as trading commenced. Traders also assessed better-than-expected economic data and what it spells for Federal Reserve policy in the future. The Dow Jones Industrial Average fell 91 points or 0.3%. The S&P 500 and Nasdaq Composite shed 0.4% and 0.7%, respectively. All the major averages opened higher but turned “negative” after job openings data for September showed a resilient labor market. Rates eased off their lows following the report, with the yield on 10-year last trading two basis points lower at 4.059%.
Market Pulse
The market pulse measuring the ratio of supply and demand seems to be evidencing the beginning of the buy-side leverage peaking. Continue to look for a “hockey stick” formation before the curve heads upward. The weekly supply is down and stands at 273. The weekly contract signed is down too and stands at “184”. Off Market is 276 listings. Some sellers capitulate and reduce list prices, but many choose to rent their property or remove the listing from the market altogether. Off-Market Inventory for this week is at 200.

Mortgage Rates Dip Under Seven Percent
Mortgage rates per Freddie Mac continue to hover around seven percent as the dynamics of a once-hot housing market have faded considerably. Unsure buyers navigating an unpredictable landscape keep demand declining while other potential buyers remain sidelined from an affordability standpoint. Yesterday’s interest rate hike by the Federal Reserve will inject additional lead into the heels of the housing market.
Sponsor Sales
“As temperatures cool, so is the new dev condo market. Activity dropped 20% last month and fell below what we’d consider a normal October. The pace of deceleration aligns with rising rates, and we’re watching that closely with another hike on the horizon.”
Kael Goodman – Co-Founder and CEO of Marketproof, Inc.
NYC’s new development activity dropped 20% in October, with 171 sponsor deals city-wide, down from 214 in September. The same period in 2021, an anomalous year in real estate, had 378 deals (-55%), but we also see a -36% dip compared to October 2019 (269 contracts). Monthly transaction volume is down and falling below pre-pandemic norms.
The dip wasn’t nearly as pronounced in the luxury sector. Sponsors reported 28 contracts on units asking above $4M, compared to 31 in September (-10%) and 22 the same month pre-pandemic.
Strength at the high-end swayed median pricing. While aggregate dollar volume was down nearly 19% at $407,020,957, median unit price and PPSF were fairly consistent at $1,455,000 (-1%) and $1,585 (-6%).
Activity dropped nearly 30%, but median prices rose significantly due to luxury transactions.
75 deals were reported across 41 projects, totaling $278,163,950 (+23%). The median unit price was up 19% to $2,710,000 (+19%), while PPSF was essentially unchanged at $2,126 (+0.23%)
TOP PERFORMERS BY CONTRACT VOLUME
Greenwich West
City’s highest contract volume: 7 contracts on 1- and 2-beds asking from $1.9M to $3.9M. Now 76% sold, C
One Wall Street
Four contracts on studios and 1-beds are asking from $1.2M to $2M. The project is averaging 3.4 monthly deals over the past 12 months.
208 Delancey St
Four contracts on the studio to 2-bed units asking from $795K to $1.6M. Now approaching 60% sold and averaging 3.5 monthly deals over the past 12 months.
Last Week
Sponsors signed 53 deals across 39 buildings, mirroring the previous week’s 52; prices were up in every boro. The aggregate dollar volume was $126,080,546 (+15%). The average asking price was $2,424,625 (+17.7%), and PPSF was $1,703 (+5.6%).
The luxury market is swaying these numbers. While contracts asking $4M+ dipped last week to 6 from 9 previously, the average unit was asking a lot more: $7,545,833 (+40.7%). The average PPSF decreased slightly to $2,332 (-4%).
Manhattan reported 21 contracts (no change),
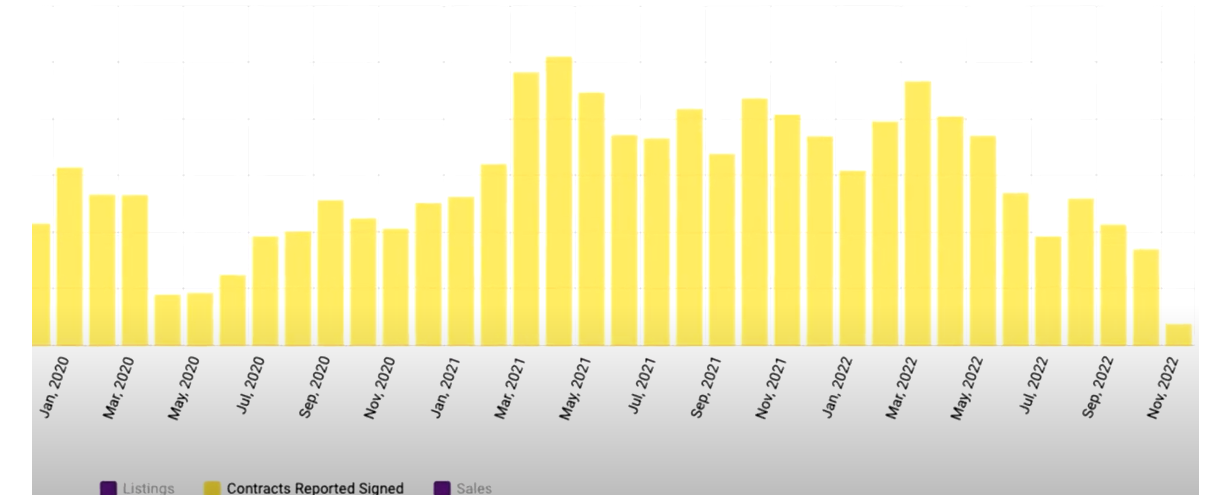
The chart below shows the shift in sponsor-signed contracts over the past few months. The sponsor contract activity is slowing below the 2019 vintage year. The Fed is bringing housing prices down by increasing rates. The luxury sector above $4 million is less affected by interest rates since many of the home purchases are with liquid cash. A recent top contract was 150 East 78th St #DPH11B asking $17M 5-bed asking $4,442 PSF.

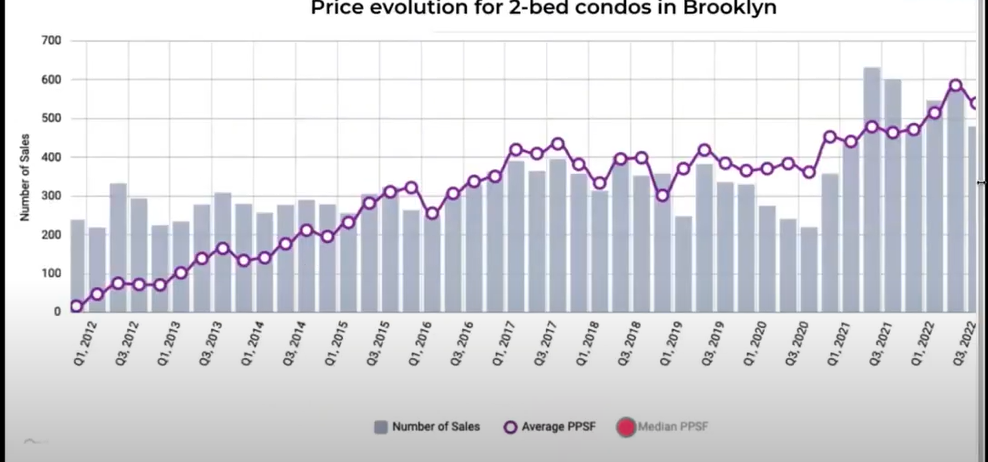
Manhattan-level prices are now witnessed in Brooklyn. As an example, the trajectory of a 2 bed in Brooklyn the average price per square foot (“ppsf”) looking back to 2012 was a little over $600 ppsf. With the advent of large new luxury developments in Brookly such as Quay Tower, One Clinton, Olympia Dumbo, Front and York, 11 Hoyt, and Brooklyn Point the price per square foot is approaching over $1,200 as shown in the graph below. Brooklyn is now in the $4 million plus price category.

2022 International Buyer’s Guide to Purchasing U.S. Property
International investment is back! To make the process seamless for international buyers, the Coldwell Banker® Brand has released a comprehensive guide on purchasing US property. Some overseas buyers are unwilling to buy in NYC currency conversion, effectively increasing acquisition costs. However, Americans are taking advantage and purchasing abroad.
Click on the Link “International Buyer’s Guide
Other educational articles about the market and your home search are under Karen’s Blog.

