Manhattan Market Report for the week ending April 28, 2023, Supply closed out at 7,273, up 2%. Pending Sales at 2,911 and off-market listings (delisting) maintain the market pulse at a .40% level. Buyers are in the market and interested in homes in good condition that are priced by the market. Those properties go into contract within 30 days. Those properties lingering for over 30 days are beginning to reduce their prices to solidify a deal before the summer months. A neutral market is good for buyers and sellers, so it’s an excellent time to take action and live the life you want in your dream house in your dream location.
“When there is time, there is no money… And when there is money, there is no time… So, if you don’t want to have regrets in this life, do it when you have either of them, don’t wait for both!”
―
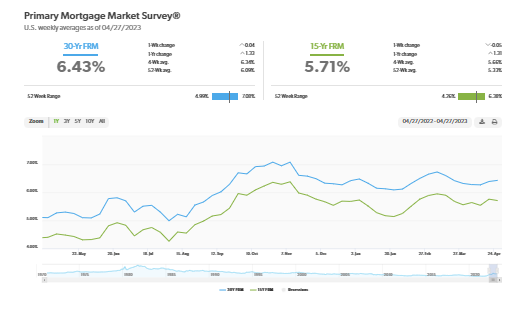
The 30-year Fixed-rate Mortgage Continues to Inch Up.
The 30-year fixed-rate mortgage increased modestly for the second straight week, but with the rate of inflation decelerating, rates should gently decline over the course of 2023. Incoming data suggest the housing market has stabilized from a sales and house price perspective. The prospect of lower mortgage rates for the remainder of the year should be welcome news to borrowers who are looking to purchase a home” – Freddie Mac | April 27, 2023
The Report
Additionally, “With affluent individuals from overseas stepping back into the game to purchase their dream property, the Coldwell Banker Global Luxury program fielded a new survey to explore the trends and attitudes of the wealthy international consumer. Polling more than 1,200 high-net-worth consumers from 12 countries on their dreams and sentiments of buying U.S. real estate, paired with our annual luxury real estate outlook.”
Furthermore, “The number of global millionaires is at its highest point in history. By 2026, it is estimated that the number of millionaires worldwide will surge by 40%, and one in seven adults will have a net worth of at least $1 million”; “The Report.”
Monthly Contract Activity
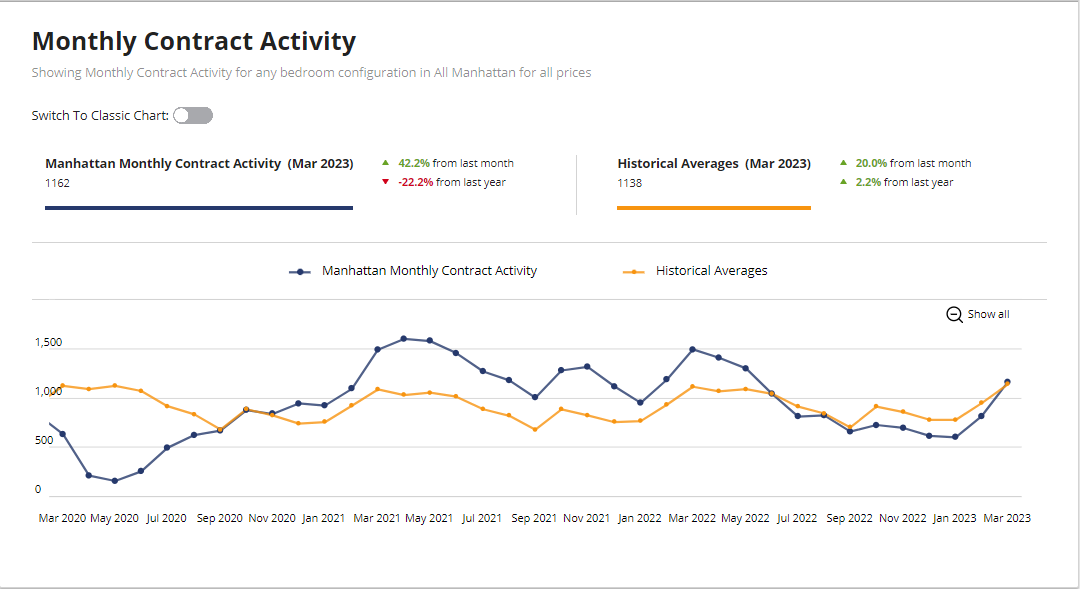
Monthly Contract Activity resides at 1162 (blue bar). The blue bar has merged with the historical average of 1138 (gold bar) and is in a range-bound market path. The Monthly Contract Activity (blue bar) converges with the Historial Averages (yellow bar).
Market Pulse
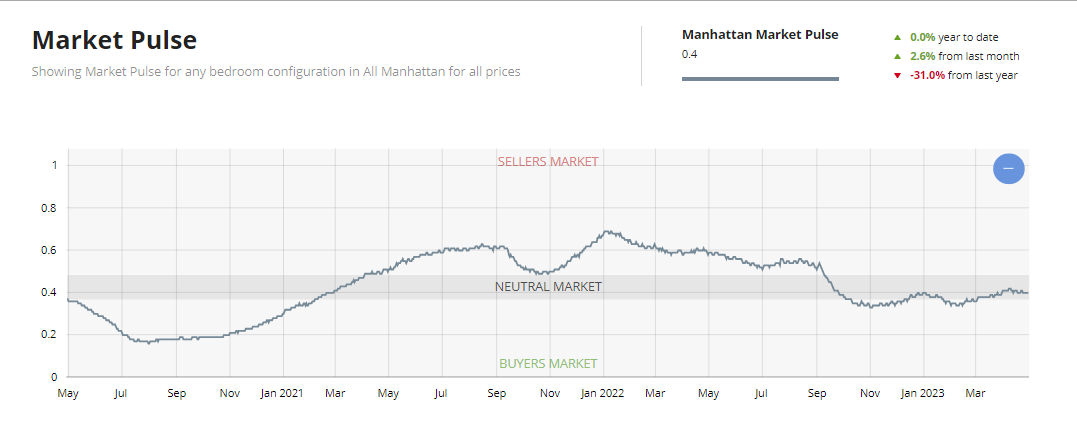
The market pulse measures the ratio of supply and demand seems to continue to evidence the beginning of the buy-side leverage peaking. The market pulse is residing in Neutral Territory – .4%. In the UrbanDigs Market Pulse, the Manhattan Pending Sales to Supply ratio is .41% (Leverage is going toward the sell side). 2,803 Contacts are waiting to close. In Manhattan, price discovery takes 4-6 months.
The weekly supply is bumped up considerably and resides at “555”; up 30%. The weekly contract signed dropped due to a holiday week and resided at “255”. Off Market is higher than recently and stands at 148 listings. The drop in weekly contracts signed, especially if prolonged, could weaken the market pulse, which is barely in the neutral zone, resulting in a compressed active season.
Liquidity Pace
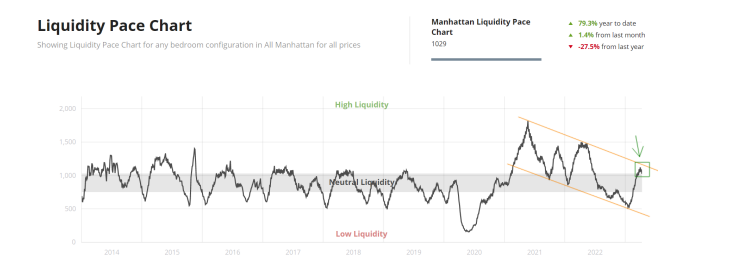
This chart displays a 30-day moving window of contract activity for the Manhattan market. Low liquidity represents a slow market, while High liquidity represents a robust market. Urban Digs Market Pulse has moved up to.41%. The wobble in the pace of liquidity suggests Manhattan may have seen its highs this season.
New Development
“This week, buyers signed 55 contracts, compared to the pre-pandemic 2015-2019 average* of 53 contracts. This marks a return to normal demand levels after the busy Spring peak. It’s worth noting that this is the 14th consecutive week of above-average volume.”
– Kael Goodman, co-founder, and CEO
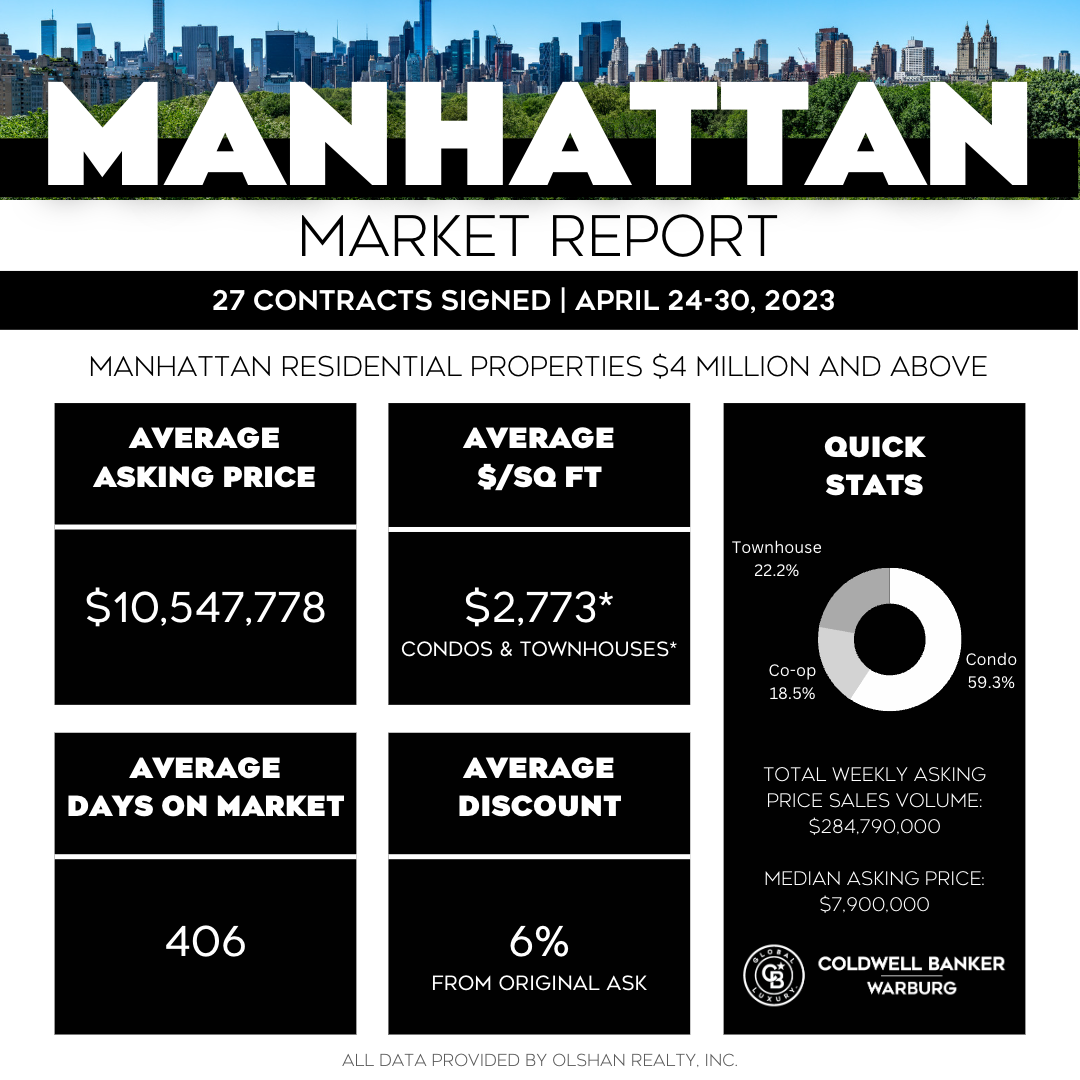
Twenty-seven (“27”) contracts were signed for listings asking $4 million and up – 16 condos, six townhouses, and five coops for the week of April 24th – 30th, per the Olshan Report. It’s worth noting that of the 27 signed contracts, eleven (“11”) were for properties asking $10 million and above – the highest number of so-called “trophy” properties since Christmas Week 2021 when the market was bustling.
Top 3 Contracts
- One Highline: 500 West 18th Street, Unit WPH34A | Asking $28 million
- 45 East 74th Street | Townhouse | Asking $26.5 million
- 90 Morton Street, Unit PH9B | Asking $19,150,000
Total Weekly Asking Price Sales Volume $284,790,000 | Average Asking Price $10,547,778 | Median Asking Price: 7,900,000 | Average Discount from Original Ask to last Asking Price: 6% | Average Days on Market: 406
UrbanDigs is reporting the supply is 421 (down 24%), Contract signed 216, and Off Market of 129 with a Market Pulse reading .40%—neutral Territory for Manhattan Overall.
Demand Normalizes After Spring Peak
This week’s contract volume continued to trend towards pre-pandemic levels, with 55 contracts signed compared to the average of 53. This marks NYC’s 14th consecutive week of above-average demand. The average price also decreased, coming in at $2.3M (–12%), leading to a total dollar volume of $127M (down from $152M). The average PPSF also decreased by 11%, falling to $1,665.
The $4M+ luxury sector underperformed its pre-pandemic benchmark of 8 contracts, posting only five this week.
Of the 55 contracts signed this week, 30 (+3%) were in Manhattan, 22 (–8%) were in Brooklyn, and 3 (–40%) were in Queens.
Manhattan Reports 30 Contracts Totaling $104M
Although contract volume increased marginally to 30 signed deals, the average price slid by –13% to $3.5M, pulling down with its total dollar volume from $116M to $104M. The average PPSF decreased from $2,382 to $2,128. Top of the leaderboard for the 11th time since launching six months ago is 300 West 30th Street, followed by One Manhattan Square. The project is now 60% sold.
