Manhattan Market Report for the week ending December 23rd, Supply closed out at 6,106 and trending downward as we close out the year. Supply is ending where it began at the beginning of the year. Pending Sales at 2,463 and off-market listings (delisting) maintain the market pulse at a .40% level. Manhattan is holding on to price action due to the resilient rental market. low supply in the sales market, and sellers choosing to rent or remove the listing from the market.
Brooklyn Supply is in a full-time contraction and closed out at 2,972. Pending Sales are 1,754 and the market pulse is at .59% in the middle of the neutral market territory. Brooklyn has been on fire and continues to be tight.
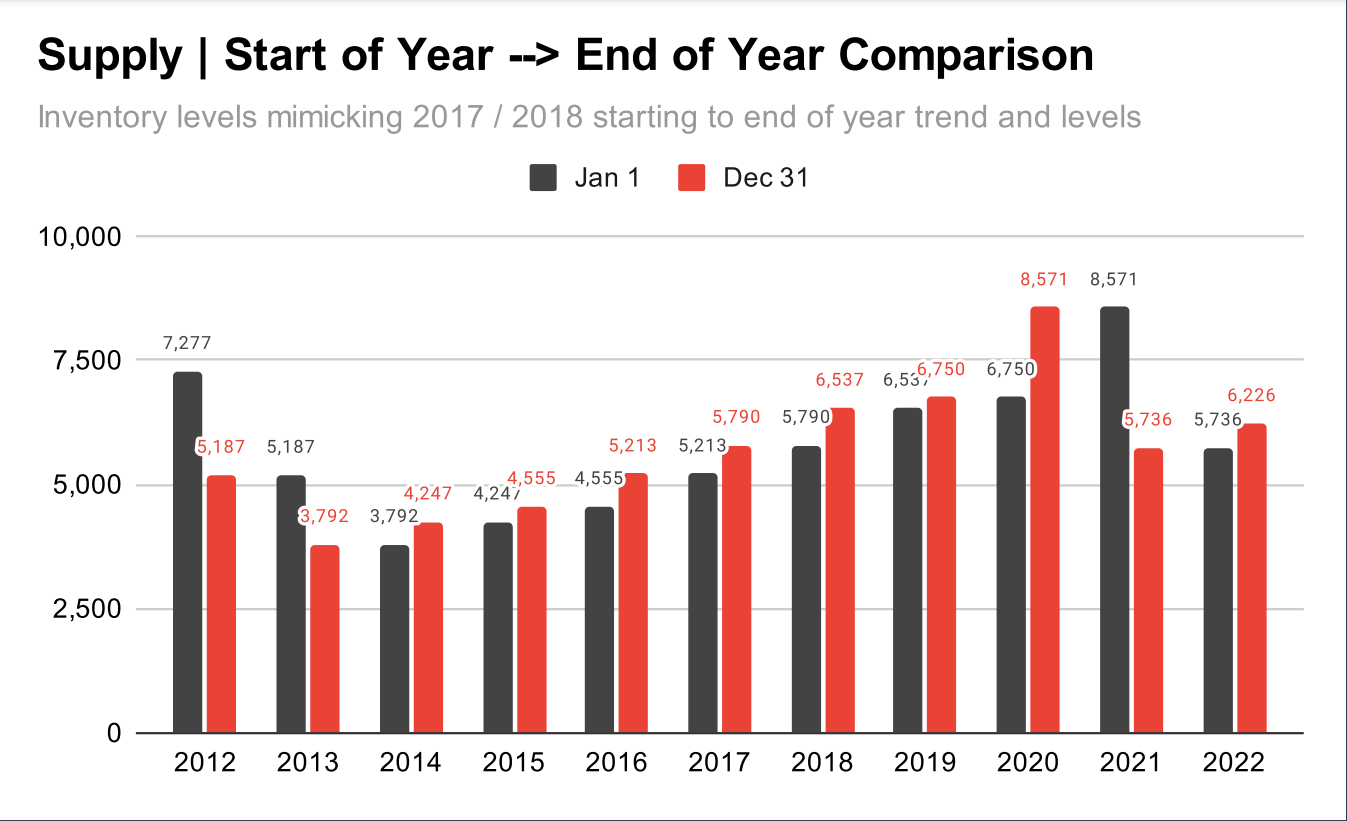
Manhattan Inventory | Start of Year versus End of Year Comparison
Supply is mimicking 2017/2018 starting to end of year trend and levels.
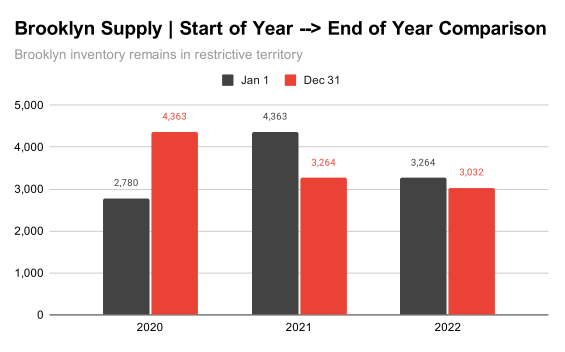
Brooklyn Inventory | Start of Year versus End of Year Comparison
Brooklyn Inventory remains in the restrictive territory.
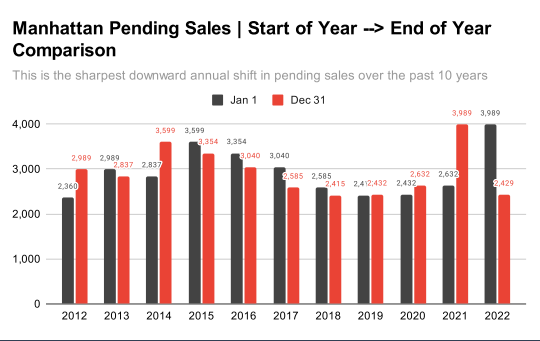
Manhattan Pending Sales | Start of Year versus End of Year Comparison
Down for the year, but in close comparison to vintage years 2018, 2019, and 2020.
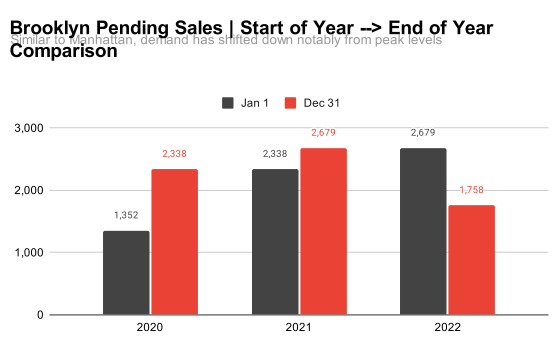
Brooklyn Inventory | Start of Year versus End of Year Comparison
Demand has shifted downward notably from its peak, but not as dramatically as Manhattans.
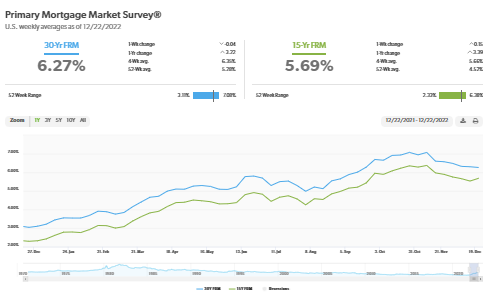
Freddie Mac Rates
The 30-Year Fixed-Rate Mortgage Continues to Trend Down heading into the holidays, mortgage rates continued to move down. Rates have declined significantly over the past six weeks, which is helpful for potential homebuyers, but new data indicates homeowners are hesitant to list their homes. Many of those homeowners are carefully weighing their options as more than two-thirds of current homeowners have a fixed mortgage rate of below four percent.
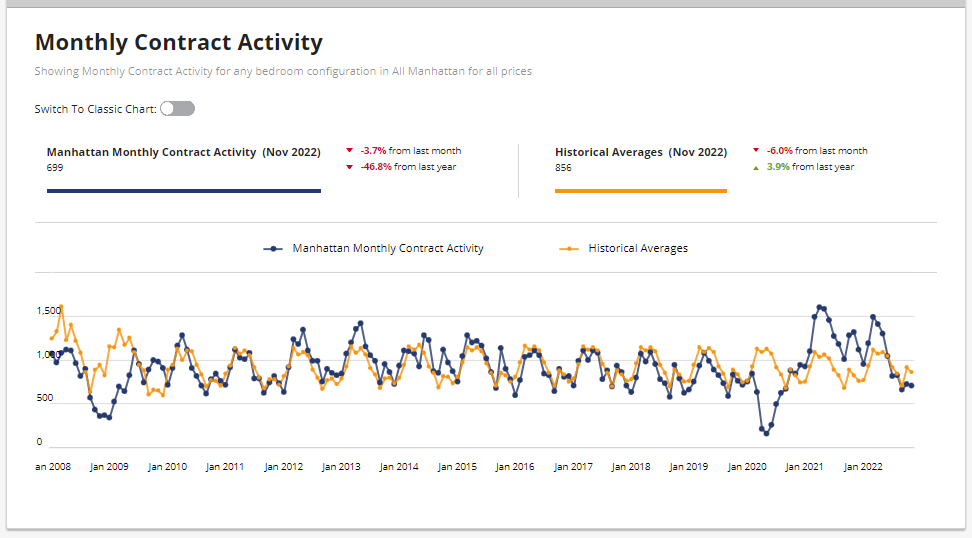
Manhattan Monthly Contract Activity
Monthly Contract Activity resides at 699 (blue bar) trends below the historical averages (gold bar) and are in a range-bound market path. The monthly Contract Activity range is dependent on “rate volatility, the Fed, risk assets, credit spread, and other macro indicators”.
Brooklyn Monthly Contract Activity
Monthly Contract Activity resides at 490 (blue bar) trends below the historical averages (gold bar) and are in a range-bound market path. The monthly Contract Activity range is dependent on “rate volatility, the Fed, risk assets, credit spread, and other macro indicators”
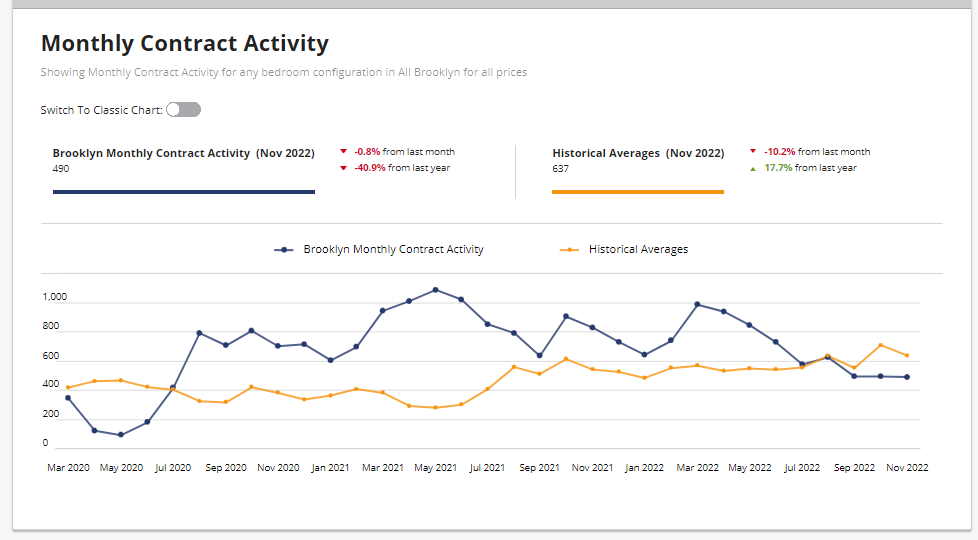
*Counts the number of contracts signed within any given month. Listings that fall out of the contract are removed from the total.
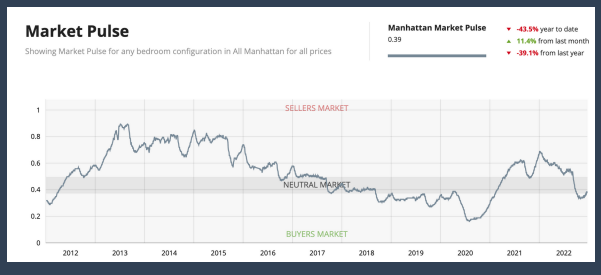
Manhattan Market Pulse
The market pulse measures the ratio of supply and demand seems to continue to evidence the beginning of the buy-side leverage peaking. UrbanDigs reports “a bottom formation tends to occur when a decelerating market starts to show signs of a positive turnaround. This reshapes the downward slope to a flatter one, and sometimes, but not always, precedes a period of recovery.
The Manhattan Market Pulse curve is rising due to lower inventory and resides in neutral territory. A lower amount of listings are coming to market and a large number of listings are being removed from the market by sellers either to refresh the listing in the new year or to market the listing to renters given the rental market continues to be strong. We are no longer in active aggressive decline. The chart reflects a sentiment of negotiation. Not necessarily a reflection of Liquidity. Liquidity is lower because the demand side is down. However, because the supply is lower the pulse is being pushed up into neutral territory.
The weekly supply as seasonally expected is down and stands at 71. The weekly contract signed is down too and stands at “132”. Off Market is 247 listings. Market Pulse resides at .39%.
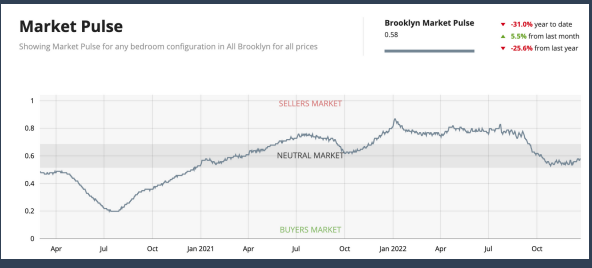
Brooklyn Market Pulse
The BrooklynMarket Pulse resides in the middle of neutral territory. The weekly supply as seasonally expected is down and stands at 36. The weekly contract signed is down too and stands at “75”. Off Market is 68 listings. Market Pulse resides at .59% and appears from the chart below to be heading higher.
Manhattan 4th Quarter Resale Condo Price Action
Manhattan Price Action is not down as evidenced in the chart below. Although the preliminary Q4 sales data is showing mixed price signals and a rebound in resale condos. Prices remain steady due to a lack of supply buyers are competing for.

Brooklyn 4th Quarter Resale Condo Price Action
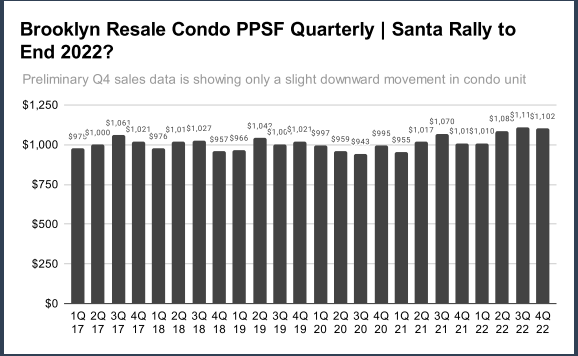
Preliminary Q4 sales data is showing only a slight downward movement in condo units.
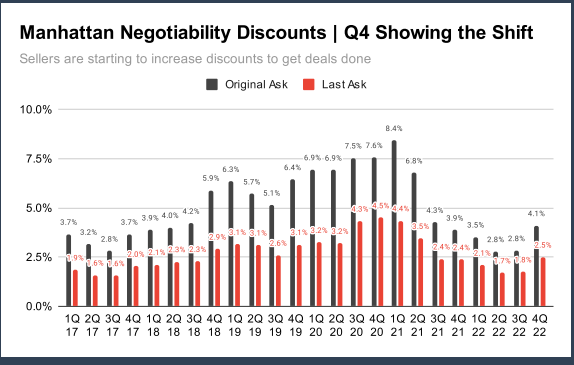
Manhattan Negotiability Discounts
Sellers are starting to increase discounts to arrive at a deal. We will see what happens in 2023!
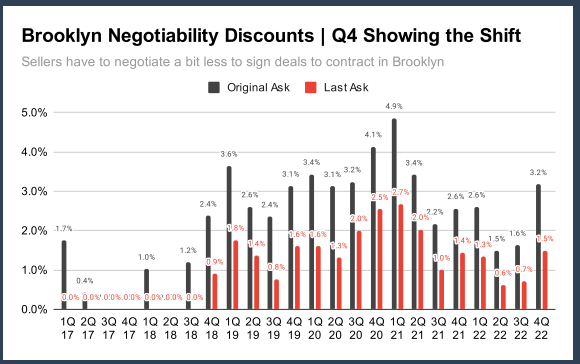
Brooklyn Negotiability Discounts
Sellers have to negotiate a bit less to sign deals to contract in Brooklyn.
Manhattan Luxury Market
Twenty-six contracts were signed the week of December 19-25th in Manhattan at $4 million more than the previous week as reported by the Olshan Report. Condos outsold coops, 15-8, and 3 townhouses in the West Village were in the mix. One reason for the last week’s Santa Claus rally was the average drop in price (from the original to the last asking price) amount the 26 contracts signed was…20%.
There was a tie for the top spot between a West Village townhouse and a Fifth Avenue coop; both asking $25 million.
- The No. 1 contract was 1040 Fifth Avenue, Unit 9/10C, asking $25 million, reduced from $32 million when it started on the market at the end of April 2021. AND…252 West 12th Street Townhouse. Asking $25 million.
- The No. 2 contract was 35 Hudson Yards, Unit 8501, asking $16,595,000, reduced from $27.5 million when the condo started marketing in April 2019 off floorplans.
- The No. 3 contract was 35 Hudson yards, Unit 8103, asking $10,950,000
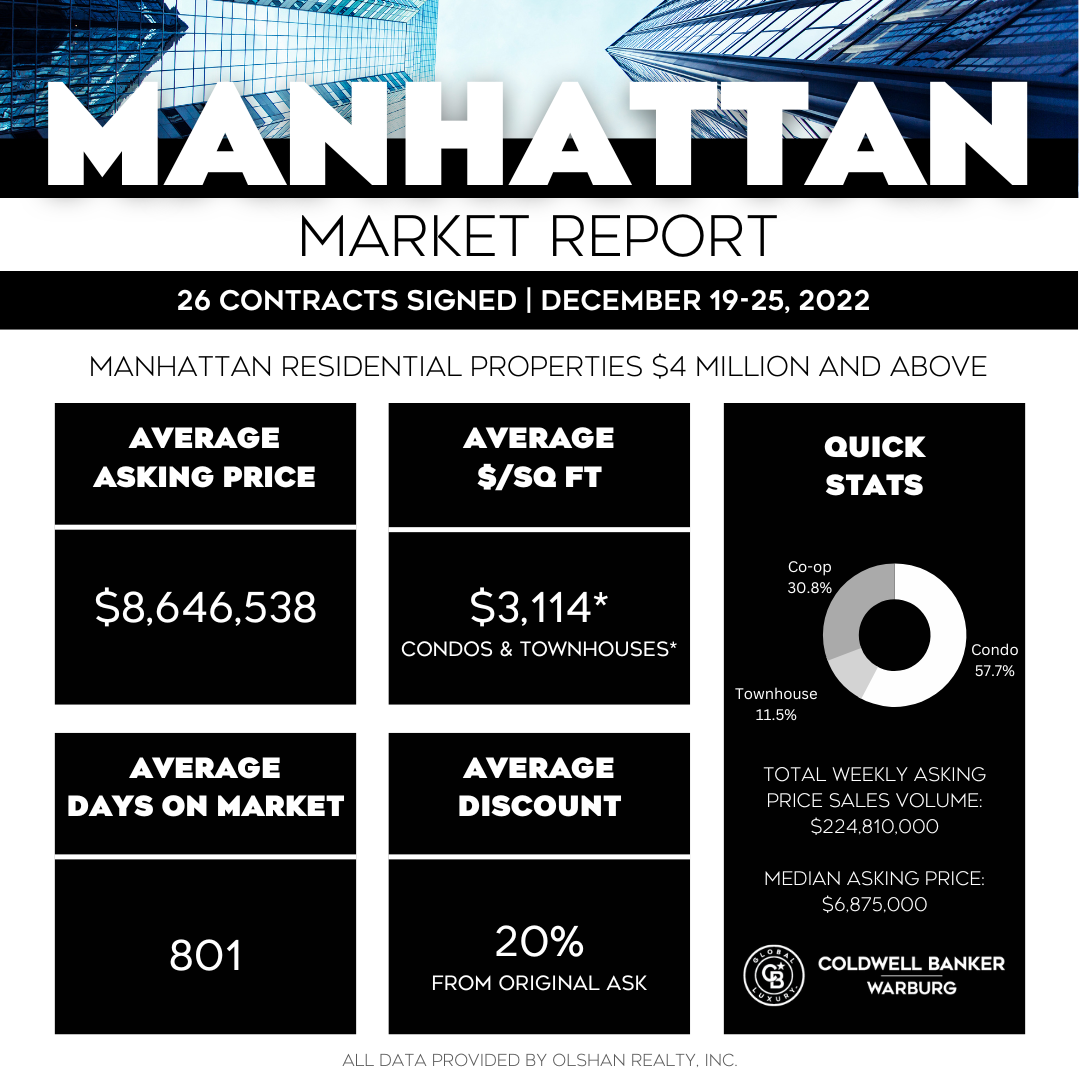
“The last time Christmas landed on Sunday was in 2016 when 17 contracts were signed. Those 26 contracts signed last week marked the best Christmas-week performance in the last 10 years. The record was set last year when 42 contracts were signed, the highest Christmas-week total since we started keeping track in 2006. The 10-year Christmas-week average is 16 contracts.”
Total Weekly Asking Price Sales Volume: $224,810,000 | Average Asking Price: $8,656,538 | Median Asking Price: $6,646,538 | Median Asking Price: $6,875,000 Average Discount from Original Asking to Last Asking Price: 20% | Average DOM: 801
Contracts Signed in 2022
Olshan Year-End Report for 2022 for contracts signed in 2022 for listings asking $4 million and above. All told, through this past week, there were 1,304 contracts signed asking $4 million and up, totaling over $10 billion in residential real estate. It’s interesting to see that 65% (836 deals) were signed in the first half of the year, and almost half that number (468) was signed in the second half of the year – exactly what we’ve been experiencing when the market “turned” sometime around April/May.
It’s also interesting to note that the number for 2022 is much closer to the results for the years 2013 thru 2019 highlighting the fact that 2020 was a Covid-related outlier in terms of low sales, and 2021 was a rebound year but also an outlier.
Sponsor Sales
December 19th through December 26th
There were 46 Sponsor Sales totaling $144,036,000 in volume for Manhattan, Brooklyn, and Queens combined.
- Manhattan Transaction Volume: $101,315,000
- Brooklyn Transaction Volume: $35,810,000
- Queens Transaction Volume: $6,911,000
The below charts are the Top 10 Sponsor Sales for Manhattan and Brooklyn.
| Manhattan Top 10
Sponsor Sales |
||
| 1 | 35 Hudson yards | $16,595,000 |
| 2 | The Leyton | $16,500,000 |
| 3 | 35 Hudson Yards | $10,950,000 |
| 4 | Two Waterline Square | $9,600,000 |
| 5 | 53W53 | $7,630,000 |
| 6 | The Wren | $6,750,000 |
| 7 | 100 Barclay | $6,450,000 |
| 8 | 35 Hudson Yards | $6,135,000 |
| 9 | 75 Kenmare | $6,000,000 |
| 10 | Everly West | $3,880,000 |
| Brooklyn Top 10 Sponsor Sales | ||
| 1 | Quay Towers | $4,700,000 |
| 2 | 11 Hoyt | $2,350,000 |
| 3 | 101 Douglass Street | $2,290,000 |
| 4 | 23 Wyckoff | $2,100,000 |
| 5 | Post House | $2,000,000 |
| 6 | The North | $1,995,000 |
| 7 | 349 Prospect Place | $1,980,000 |
| 8 | The North | $1,765,000 |
| 9 | 1080 Lorimer | $1,700,000 |
| 10 | 1080 Lorimer | $1,700,000 |
Top 20 Buildings Ranked by 3-Months Velocity
The top buildings by Sales Velocity are 1) 208 Delancy, 2) The North in Brooklyn, and 3) 11 Hoyt Street; see the chart below.

Thank You
I am ever so grateful for the growing number of people choosing and recommending Coldwell Banker Warburg as their number-one team. Selling luxury real estate is an art form and a craft. It’s the reason why Coldwell Banker is trusted with over $270 million in luxury sales every single day. *
A new year brings new beginnings and fresh energy. As I begin to prepare for 2023, I would like to hear from you. I am eager to learn what I can do for you to make it possible for you to have the life you have always envisioned for yourself.
There are opportunities in the market and together we can make the future brighter in 2023.
Curious to find out your buying or selling power in this market contact me to discuss your plans. Book a call by connecting with me on my website to discuss plans to buy or sell in New York City. I look forward to hearing from you!
Connect With Me

Karen’s extensive background in real estate financial markets empowers her to not only understand the economic aspects of a home sale or purchase but the emotional components that can hinder a transaction from closing quickly and seamlessly. A dual-licensed salesperson in New York with Coldwell Banker Warburg and in New Jersey with Elite Realtors. She represents a variety of property types, including new developments, co-ops, townhomes, and condos.
Contact Karen with questions about the New York City Market or a specific local market.
Other educational articles about the market and your home search are under Karen’s Blog.
Coldwell Banker Luxury Program
The Coldwell Banker Global Luxury program sets the gold standard for modern luxury real estate marketing, continuing a legacy established by the Coldwell Banker® brand in 1906. Coldwell Banker Global Luxury Property Specialists are an exclusive group within the Coldwell Banker organization, making up under ten percent of independent sales associates affiliated with the brand worldwide. They are known for selling some of the world’s most significant properties. In 2021, Coldwell Banker-affiliated agents handled 50,353 transaction sides of $1 million+ sides (a 54% increase from 2020), equating to $267 million in luxury sales every day.
This enduring record continues to raise the Coldwell Banker Global Luxury program to the highest echelons of the real estate market.
