Manhattan Market Report for the week ending April 21, 2023, Supply closed out at 7,092. Pending Sales at 2,898 and off-market listings (delisting) maintain the market pulse at a .41% level.
Mortgage Rates
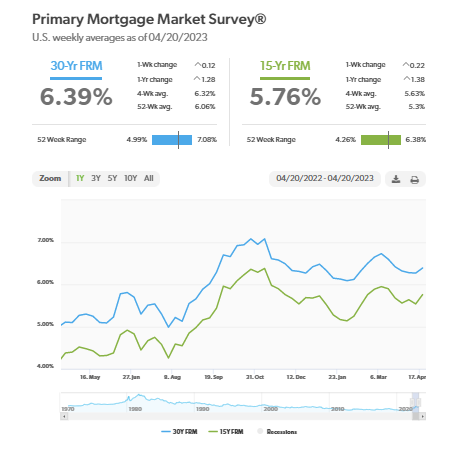
Mortgage rates increased for the first time in over a month due to shifting market expectations. Home prices have stabilized somewhat, but with supply tight and rates stuck above six percent, affordable housing continues to be a serious issue for potential homebuyers. Demand will only modestly recover if rates drop into the mid-five percent range.– Freddie Mac April 20, 2023
The Report
Additionally, “With affluent individuals from overseas stepping back into the game to purchase their dream property, the Coldwell Banker Global Luxury program fielded a new survey to explore the trends and attitudes of the wealthy international consumer. Polling more than 1,200 high-net-worth consumers from 12 countries on their dreams and sentiments of buying U.S. real estate, paired with our annual luxury real estate outlook.”
Furthermore, “The number of global millionaires is at its highest point in history. By 2026, it is estimated that the number of millionaires worldwide will surge by 40%, and one in seven adults will have a net worth of at least $1 million”; “The Report.”
Monthly Contract Activity
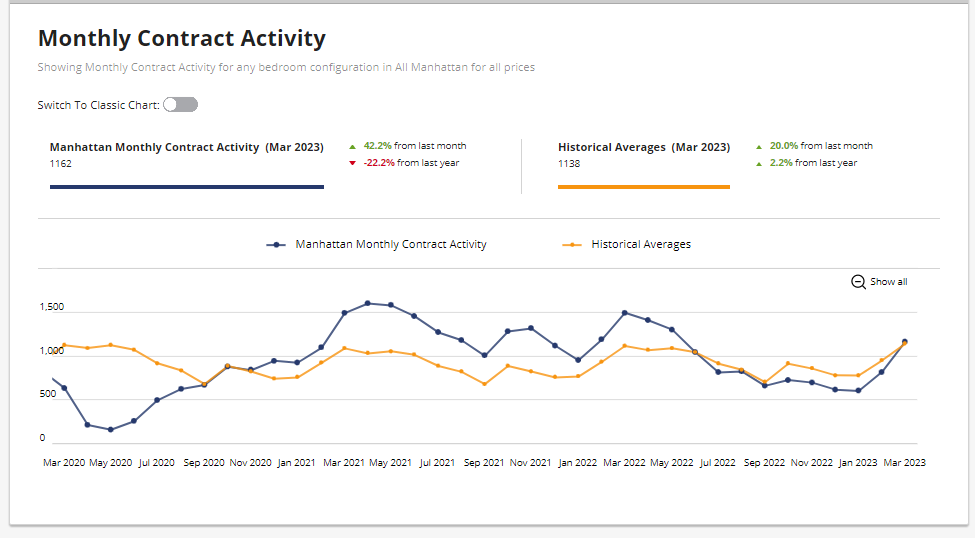
Monthly Contract Activity resides at 1162 (blue bar). The blue bar has merged with the historical average of 1138 (gold bar) and is in a range-bound market path. The Monthly Contract Activity (blue bar) converges with the Historial Averages (yellow bar).
Market Pulse
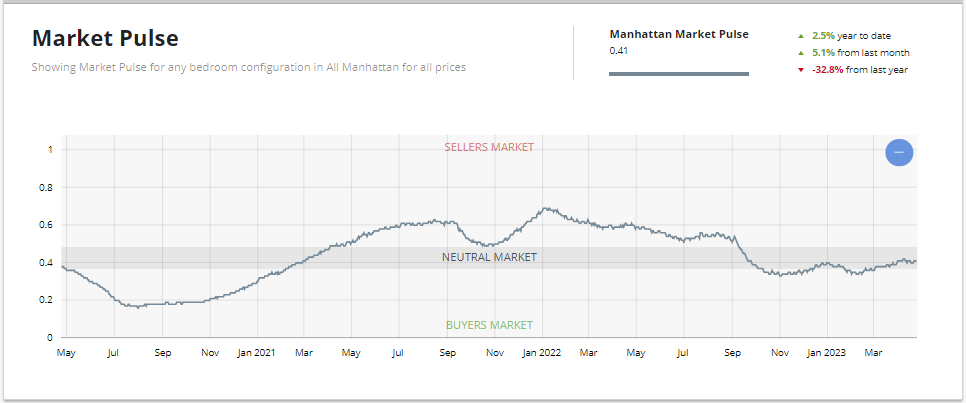
The market pulse measures the ratio of supply and demand seems to continue to evidence the beginning of the buy-side leverage peaking. The market pulse is residing in Neutral Territory – .4%. In the UrbanDigs Market Pulse, the Manhattan Pending Sales to Supply ratio is .41% (Leverage is going toward the sell side). 2,803 Contacts are waiting to close. In Manhattan, price discovery takes 4-6 months.
The weekly supply is bumped up considerably and resides at “555”; up 30%. The weekly contract signed dropped due to a holiday week and resided at “255”. Off Market is higher than recently and stands at 148 listings. The drop in weekly contracts signed, especially if prolonged, could weaken the market pulse, which is barely in the neutral zone, resulting in a compressed active season.
Liquidity Pace
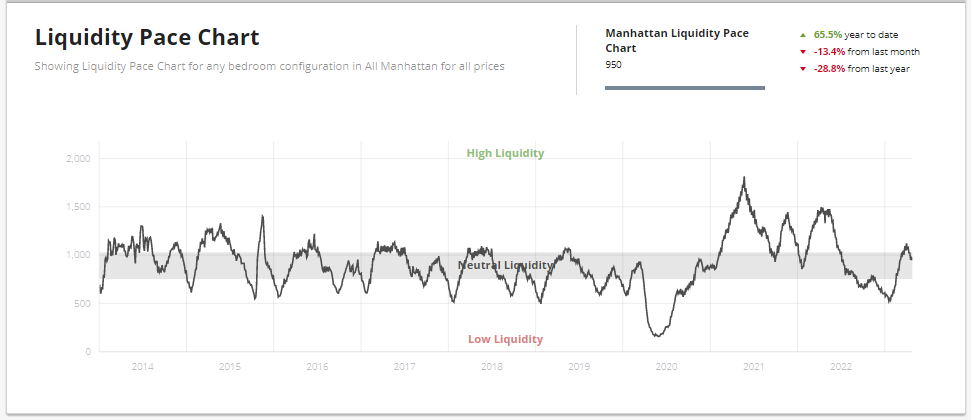
This chart displays a 30-day moving window of contract activity for the Manhattan market. Low liquidity represents a slow market, while High liquidity represents a robust market. Urban Digs Market Pulse has moved up to.41%. The wobble in the pace of liquidity suggests Manhattan may have seen its highs this season.
New Development
“Buyers signed 58 contracts this week, enough to extend NYC’s winning streak* to 13 weeks. Demand has cooled since the week of March 27 when 90 deals were signed, but this is to be expected since Spring contract volume typically peaks in the second half of March or the first week of April.”
– Kael Goodman, co-founder, and CEO
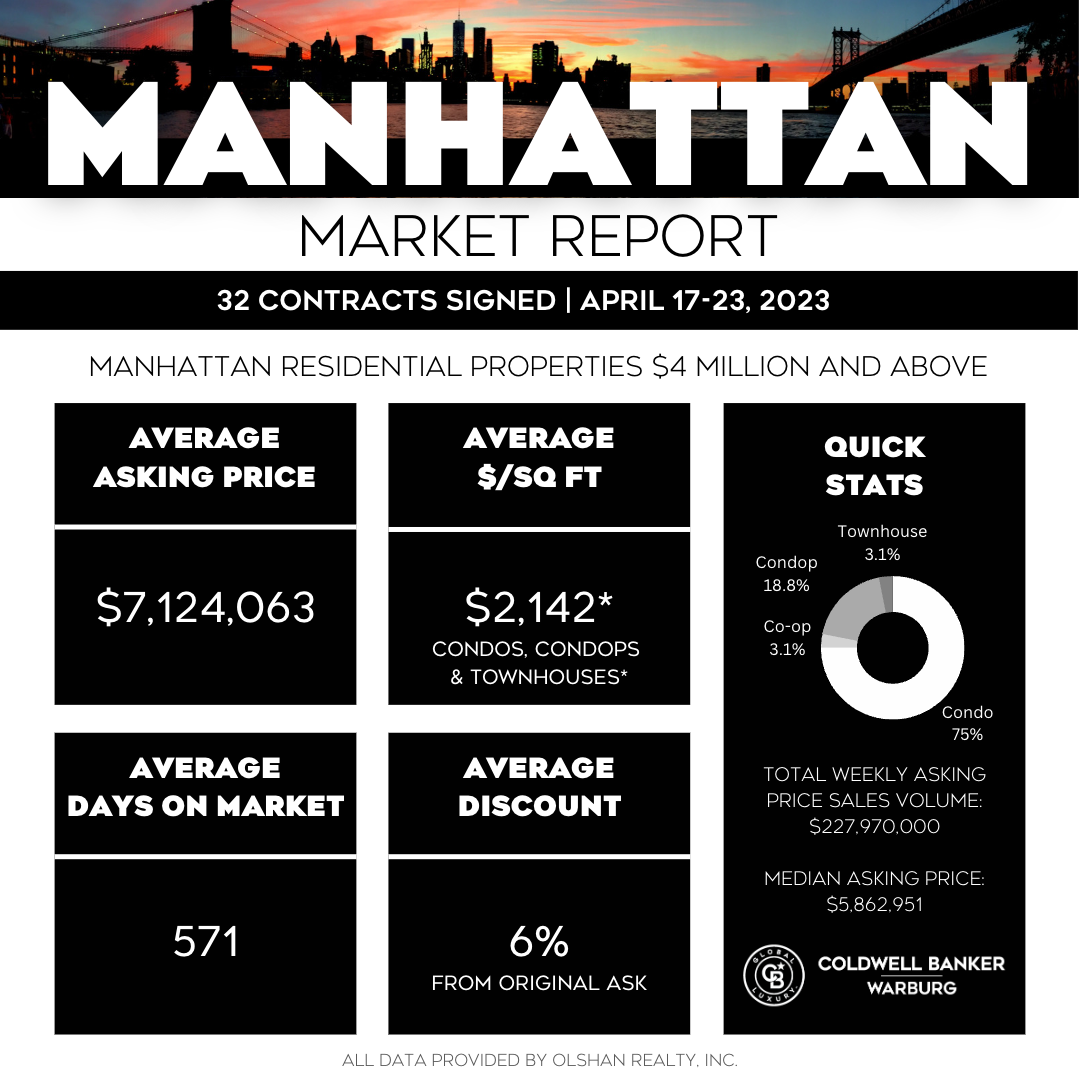
Thirty-two contracts were signed last week in Manhattan at $4 million and above (Week of April 17-23), six more than the previous week, per the Olshan Report.
Condos – 24 | Coops – 6 | Townhouse – 1
Top 3 Contracts
- 1. 433 Greenwich Street, Unit 5H | Asking: $15.9 million
- 2. 190 Riverside Drive, Unit PH | Asking: $15 million
- 3. 53 West 53rdStreet, Unit 57B | Asking $15.140 million
(Jean Nouvel, Pritzker Prize Winner architect)
UrbanDigs is reporting the supply is at a high of 458, Contract signed of 229, and Off Market of 144 with a Market Pulse reading .41%—neutral Territory for Manhattan Overall.
Total Weekly Asking Price Sales Volume: $262,455,000 | Average Asking Price: $7,719265 | Median Asking Price: $6,200,000 | Average Discount from Original Ask to Last Asking Price: 11% | Average Days on Market: 465.
Spring Demand May Have Peaked, but Buyers Extend the Streak
“History suggests that the 90 deals during the week of March 27th may have been the seasonal peak. However, that didn’t stop buyers from signing 58 contracts this week – compared to the pre-pandemic average of 53 – and extending NYC’s winning streak to thirteen consecutive weeks. A week-over-week comparison must consider that last week was dominated by many previously unreported contracts at Long Island City’s The Greene. This week, contract volume was down 34%, but total dollar volume was stable at $152M because the average price was up 49% to $2.6M. Average PPSF was higher by 17% to $1,874.” – Market Proof.
The $4M+ luxury sector posted an intense week, with 11 contracts compared to its pre-pandemic benchmark of 8. Of the 58 contracts signed this week, 29 (+32%) were in Manhattan, 24 (+4%) were in Brooklyn, and five were in Queens – Per Market Proof.
Manhattan Reports 29 Contracts Totaling $116M
Average price and contract volume grew this week to $4.0M (+2%) and 29 (+32%), so total dollar volume increased proportionately by 35% to $116M. The average PPSF increased from $2,207 to $2,382.
The Cortland, with three contracts, and 300 West 30th, with two contracts, were the top performers.

