Manhattan Market Report for the week ending March 10th, 2023, Supply closed out at 6,370 and trended upward. Pending Sales at 2,453 and off-market listings (delisting) maintain the market pulse at a .39% level. Demand continues to tick higher and build momentum as we enter the spring market. The Activity these past few weeks is evidencing a healthy market.
The Report
Additionally, “With affluent individuals from overseas stepping back into the game to purchase their dream property, the Coldwell Banker Global Luxury program fielded a new survey to explore the trends and attitudes of the wealthy international consumer. Polling more than 1,200 high-net-worth consumers from 12 countries on their dreams and sentiments of buying U.S. real estate, paired with our annual luxury real estate outlook.”
Furthermore, “The number of global millionaires is at its highest point in history. By 2026, it is estimated that the number of millionaires worldwide will surge by 40%, and one in seven adults will have a net worth of at least $1 million”; “The Report.”
Silicon Valley Bank and Signature Bank
I am experiencing Deja vu from the savings and loan crisis of the late 80s. The sudden unraveling of Silicon Valley Bank and Signature Bank recently. It appears that from the top down, all oversight parties were laissez-faire. With a whip-saw in interest rate movement in a short period, you would think alert bells would have gone off in the risk management stress tests before the crisis.
5 Reasons the Fed Should Pause Tightening
Rod Dubitsky, Executive Director at Financial Inclusion Forum and Cofounder of The People’s Economist, Investigative Journalist’s article “The Pause that Refreshes: 5 Reasons the Fed Should Pause Tightening,” was written in November 2022. His “main point was that tightening risks were still percolating through the global economy, and they hadn’t adequately evaluated the fallout from tightening. Two medium-sized bank failures and bailouts later. The latent risks from tightening weren’t considered enough. Also, we have now taken as gospel that central banks are the primary inflation-fighting engine. There should be a stronger fiscal response because there are specific components in this inflation cycle (supply chain bottlenecks, anticompetitive pricing, regulation). The burden of fighting inflation should be a balance between Fiscal and Monetary responses. Monetary Policy is the hatchet, while Fiscal policy is the scalpel. We tend to overly fetishize the Volcker approach to inflation.”
Mortgage Rates

Mortgage rates continue progressing as the Federal Reserve signals a more aggressive stance on monetary policy. Overall, consumers are spending in sectors that are not interest rate sensitive, such as travel and dining out. However, rate-sensitive sectors like housing continue to be adversely affected. As a result, would-be homebuyers continue to face the compounding challenges of affordability and low inventory. – Freddie Mac
“The speed with which mortgage rates have increased in recent months has been whiplash-inducing, and the cumulative effect — from near 3 percent at the beginning of the year to near 7 percent now — would’ve seemed laughably unlikely at the beginning of the year,” says Greg McBride, a chief financial analyst for Bankrate. “Inflation running at 40-year highs will do that.”
The central bank raised rates again at its November meeting — but what comes next is a toss-up. Some anticipate more forward marching for mortgage rates, possibly tapping 8 percent, while others say subsequent Fed hikes have already been accounted for and rates should stabilize. Others see the Fed pulling back at the end of the year.” — Bank Rate
A slower rate increase may be on the table after the Silicon Valley, and Signature Bank credit crisis was unveiled.
Monthly Contract Activity
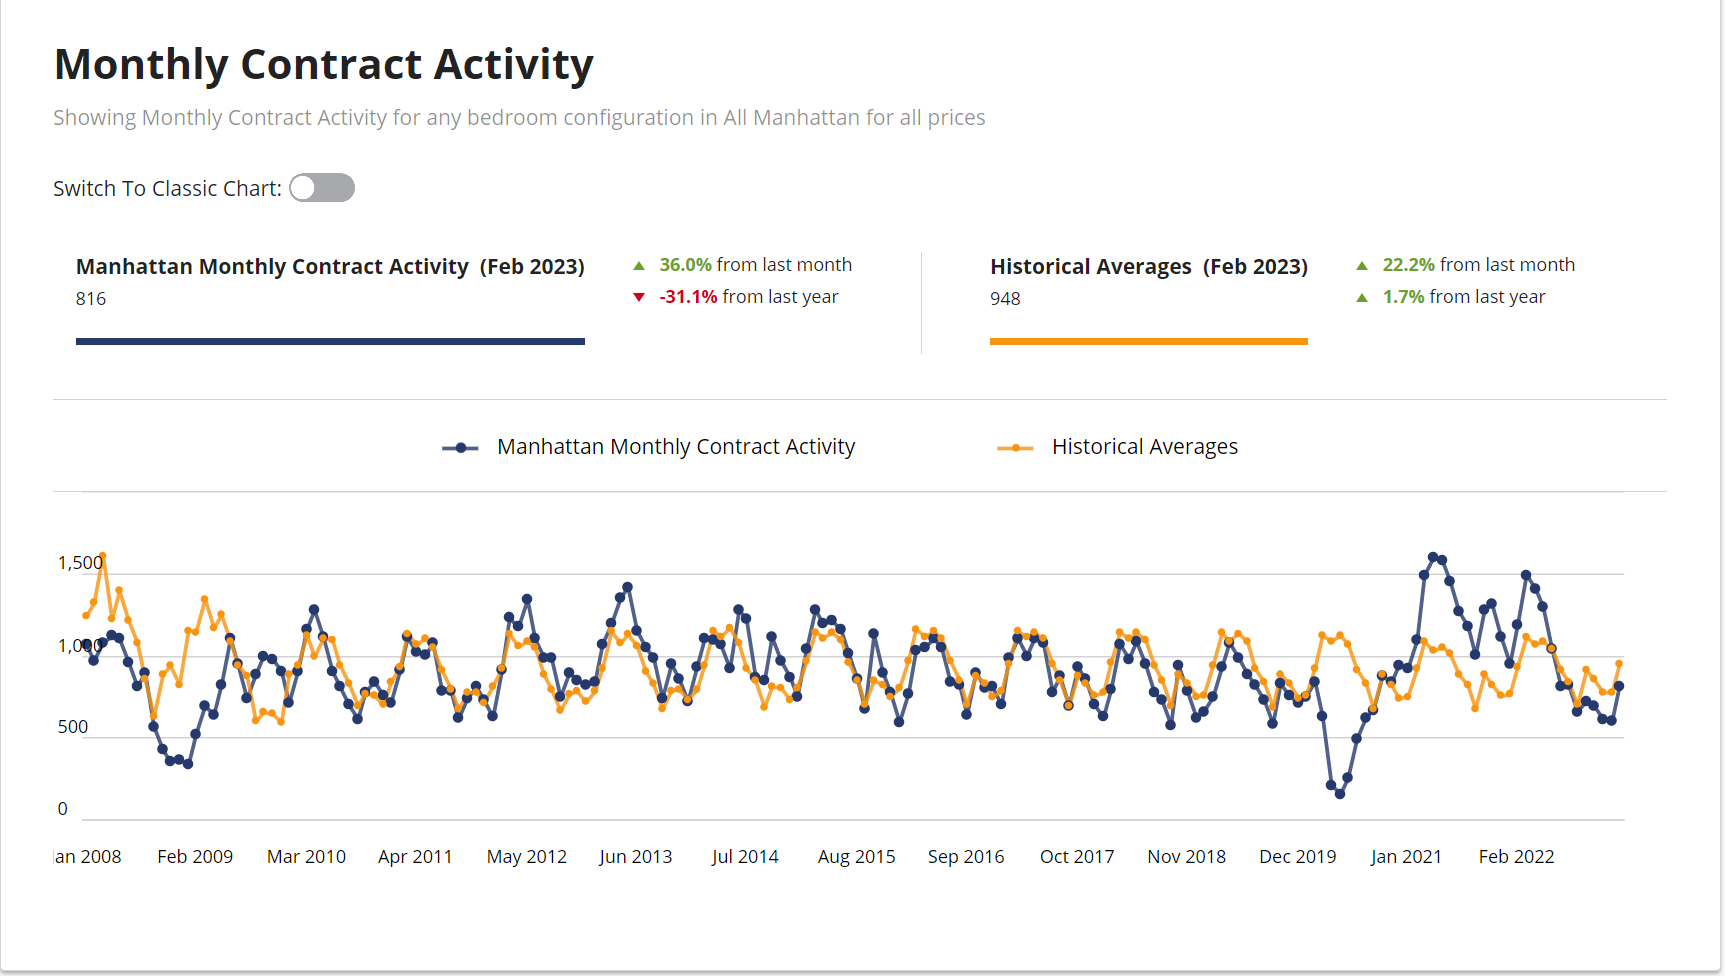
Monthly Contract Activity resides at 816 (blue bar). Slightly below the historical average of 948 (gold bar) and is in a range-bound market path. Contracts Signed activity has picked up and is visible in the graph below, showing the blue bar spiking upward.

Market Pulse
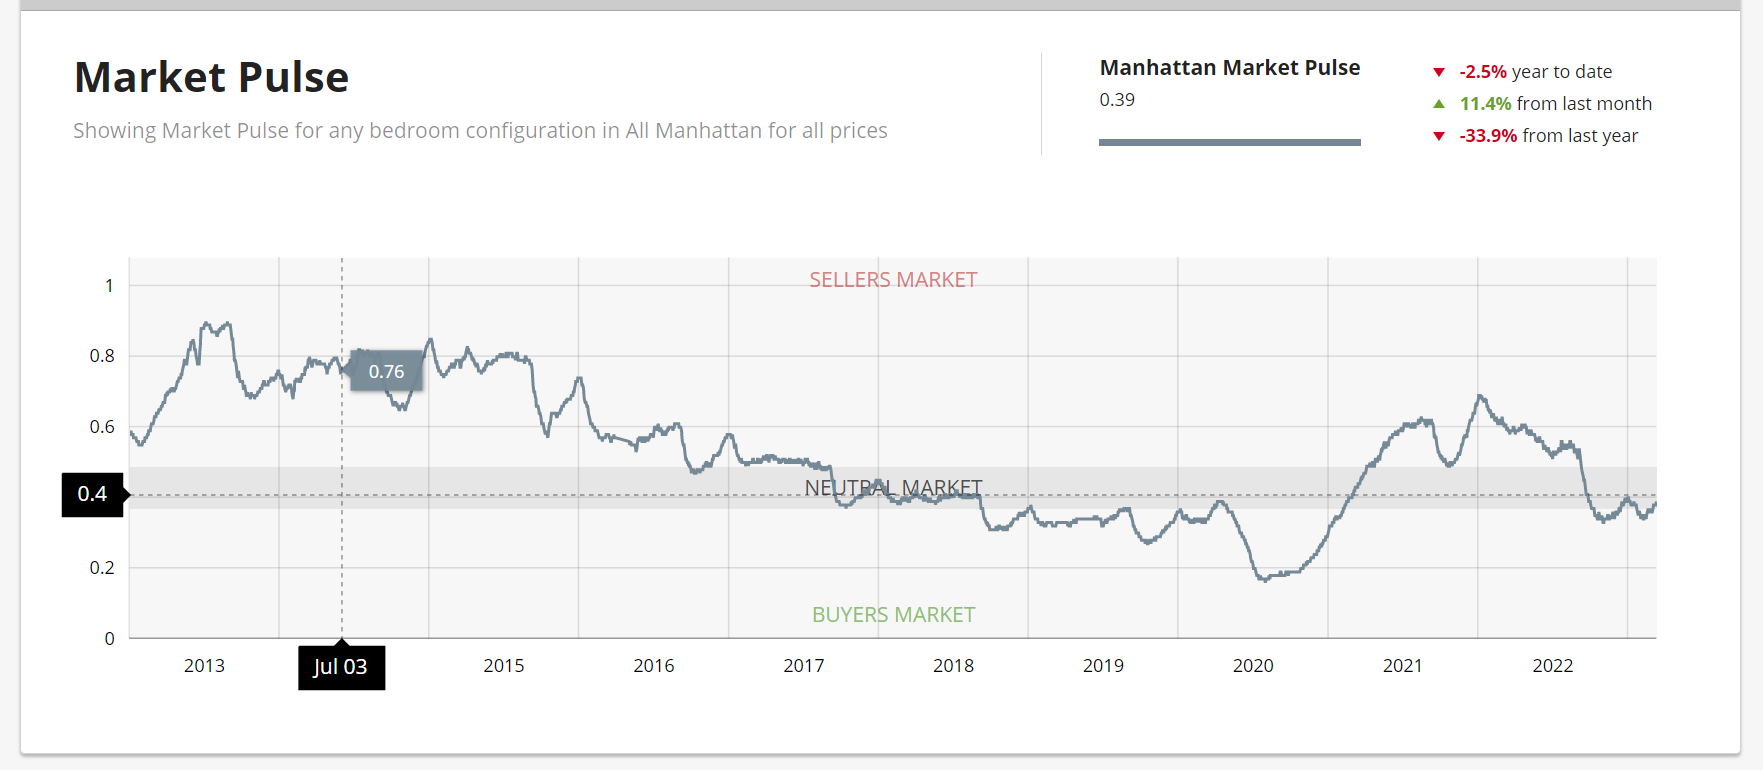
The market pulse measures the ratio of supply and demand seems to continue to evidence the beginning of the buy-side leverage peaking. The weekly supply has spiked upward and resides at “439”. The weekly contract signed has risen and resides at “259”. Off Market is lower than recently and stands at 129 listings. We are out of the low liquidity zone and shifting to the neutral zone as we enter the busy spring season. There are micro markets in Manhattan in the Seller Zone. NOTE this is not price volume. This is deal volume showing that sellers are receiving bids.

Luxury Market
“Take note: New dev contracts signed are now higher than the pre-pandemic 2015-2019 average* for the 7th consecutive week.“– Kael Goodman, co-founder and CEO* Used as a normalized benchmark for comparison as it is the most recent period unaffected by the COVID pandemic.
The Luxury Market for properties $4 million and above, per the Olshan report for the week of March 6 to 12th, 2023, inked 36 contracts. Marking the largest total of the year. As well as the largest total since May 9-15, 2022, when 39 contracts were signed.
It was the third week in a row of double-digit negotiability. The last three weeks averaged 12% (The negotiability stat in this report is the difference between the original asking price and the previous asking price before a property goes into contract).
Condos – 25 | Coops 8 | Condop 1 and | Townhouses 2
Total Weekly Asking Price Sales Volume: $268,9967,500 | Average Asking Price: $7,472,153 | Median Asking Price: $5,872,500 | Average Discount from Original Ask to Last Asking Price: 15% | Average Days on Market: 691
Top 3 Contracts Signed
- 164 Charles Street, TRIPLEX, Asking $37 million
- 133 East 80th Street, Unit 10/11A, Asking $13.995 million
- 211 Central Park West Unit 5D, Asking $11,995 million
Sponsor Sales
At 7 Consecutive Weeks, NYC’s Above Normal Demand Becomes a Trend
“Demand for new development – as a measure by the number of contracts signed – increased 5% week-over-week to 68. Also, 27% more than the pre-pandemic 2015-2019 weekly average of 53 contracts. Although more numerous, this week’s deals were less expensive. The average price of $2.2M (–9%) pulls total dollar volume down 5% to $150M. Furthermore, the average PPSF also slid 4% to $1,724.Moreover, demand for $4M+ luxury products was more robust for the second week. And more than the pre-pandemic average, with ten contracts signed versus eight.Of the 68 contracts this week, 36 were again “signed” in Manhattan. Furthermore, there were 28 (+8%) “signed” in Brooklyn, and 4 (+33%) were “recorded” in Queens.” – Market Proof
Manhattan Reports 36 Contracts Totaling $100MManhattan retains its 6-month high level of demand with 36 sponsor contracts. Furthermore, the average deal was 19% less expensive at $2.8M. Pulling total dollar volume down from $123M to $100M. Average PPSF decreases as well, down 6% week-over-week to $2,079. The top Contracts are at 300 West 30th Street and 450 West Street.

