Manhattan Market Report for the week ending March 31st, 2023, Supply closed out at 6,711 and trended upward. Pending Sales at 2,698 and off-market listings (delisting) maintain the market pulse at a .41% level. The market’s liquidity is trending upward.

The Report
Additionally, “With affluent individuals from overseas stepping back into the game to purchase their dream property, the Coldwell Banker Global Luxury program fielded a new survey to explore the trends and attitudes of the wealthy international consumer. Polling more than 1,200 high-net-worth consumers from 12 countries on their dreams and sentiments of buying U.S. real estate, paired with our annual luxury real estate outlook.”
Furthermore, “The number of global millionaires is at its highest point in history. By 2026, it is estimated that the number of millionaires worldwide will surge by 40%, and one in seven adults will have a net worth of at least $1 million”; “The Report.”
Mortgage Rates Decrease for the Third Consecutive Week
March 30, 2023
Economic uncertainty continues to bring mortgage rates down. Over the last several weeks, declining rates have returned borrowers to the market. Still, as the spring homebuying season begins, low inventory remains a crucial challenge for prospective buyers. – Freddie Mac
Tuesday, April 04, 2023, the current average 30-year fixed mortgage interest rate is 6.75%, decreasing 14 basis points from a week ago. – Bank Rate
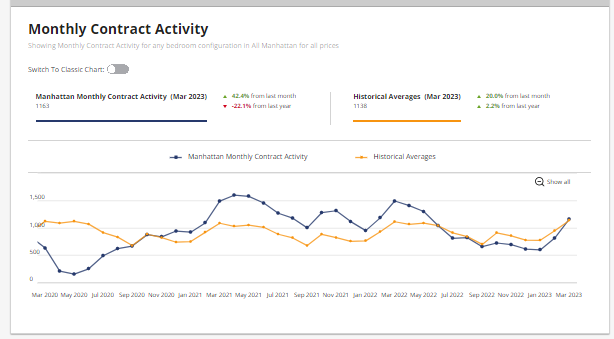
Monthly Contract Activity
Monthly Contract Activity resides at 817 (blue bar). Slightly below the historical average of 948 (gold bar) and is in a range-bound market path. Contracts Signed activity has picked up and is visible in the graph below, showing the blue bar spiking upward.

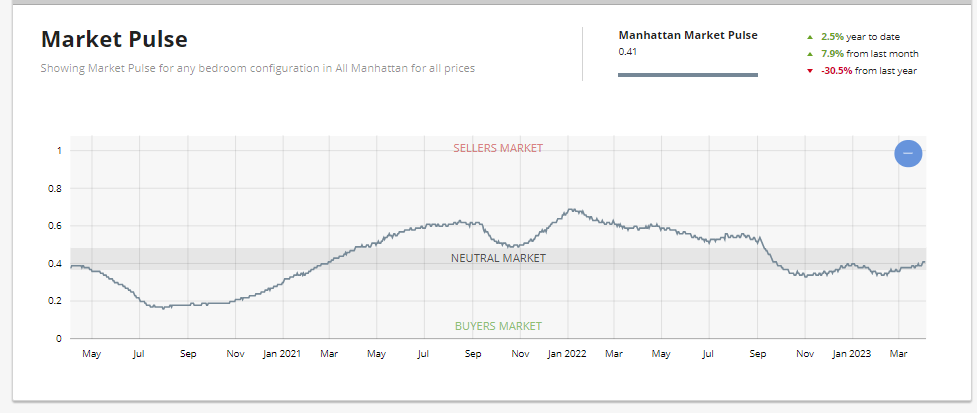
Market Pulse
The market pulse measures the ratio of supply and demand seems to continue to evidence the beginning of the buy-side leverage peaking. The market pulse is residing in Neutral Territory – .4%. In the UrbanDigs Market Pulse, the Manhattan Pending Sales to Supply ratio is .4% (Leverage is going toward the sell side). 2,676 Contacts are waiting to close. In Manhattan, price discovery takes 4-6 months.
The weekly supply is down and resides at “389”. The weekly contract signed has risen and resides at “263”. Off Market is lower than recently and stands at 132 listings. We are out of the low liquidity zone and shifting to the neutral zone as we enter the busy spring season. There are micro markets in Manhattan in the Seller Zone. NOTE this is not price volume. This is deal volume showing that sellers are receiving bids.

Liquidity Pace
This chart displays a 30-day moving window of contract activity for the Manhattan market. Low liquidity represents a slow market, while High liquidity represents a robust market. Urban Digs Market Pulse has moved up to.42%. Weekly Supply is hovering around 400, and Contracts signed have moved up to 274. Demand is outpacing supply.

New Development
“Seasonal home buying is in full swing, with the highest weekly number of new dev contracts in nearly a year. But this isn’t just your typical Spring demand – contract volume for March was stronger than any on record during the pre-pandemic 2015-2019 period* and Q1-2023 was 11% stronger than the average first quarter during that same period .”
– Kael Goodman, co-founder, and CEO
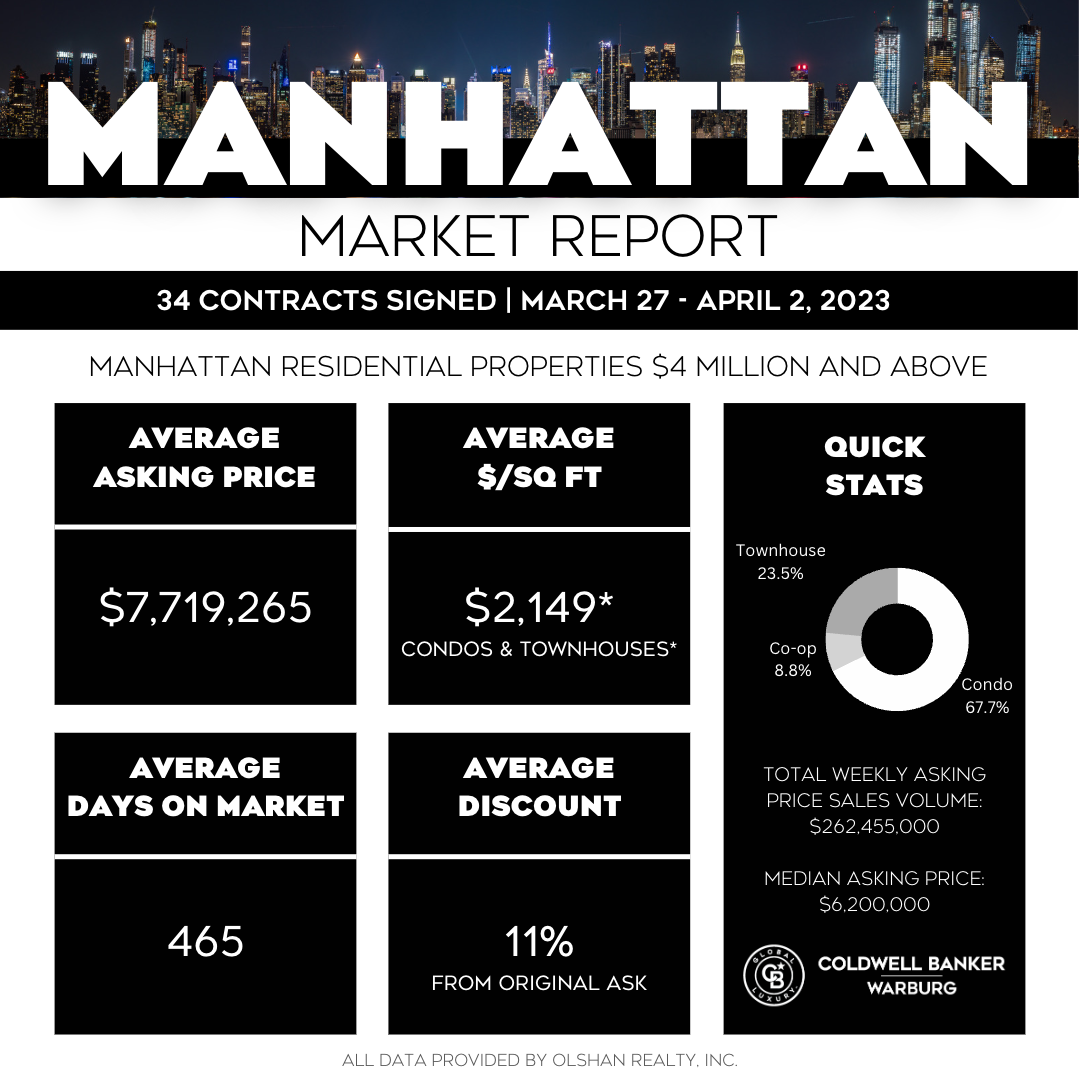
Another intense week with 34 contracts signed for listings asking $4 million and up – 2 more than the previous week. Interestingly, while condos continue to dominate, townhouses outsold co-ops – 8 townhomes sold versus just three co-ops as reported by the Olshan Report for the week of March 27 – April 2nd.
23 Condos | 3 Coops | Condops 0 and 8 townhouse
But it’s worth a deeper dive – the top sale was a townhouse at 7 Sutton Square that was first listed seven years ago for almost $40 million and last asking $29.5 million – no indication of the actual sales price. And the No. 2 sale was 14 East 69th Street, first listed for $29.75 million 2 years ago and last asking $26.5 million – but four days after the contract was signed, the property closed quickly for $18.3 million (a huge discount) in a rush to avoid a foreclosure.
Top 3 Contracts
- 7 Sutton Square | Townhouse | Asking $29.5 million
- 14 East 69th Street | Townhouse | $26.5 million
- 60 East 86thStreet – T/H | $13,500,000
Total Weekly Asking Price Sales Volume: $262,455,000 | Average Asking Price: $7,719,265 | Median Asking Price: $6,200,000 | Average Discount from Original Ask to Last Asking Price: 11% | Average Days on Market: 465

2023’s Largest Sale and Demand Compete for the Spotlight
This week’s news of 11-month high contract activity and a 10th consecutive posting above the pre-pandemic average could only be eclipsed by an even flashier headline from the closing records, and the Naftali Group delivered just that with a $66.5M sale – by far the largest of 2023 – within their RAMSA-designed UES project, The Bellemont.
Despite the average price and average PPSF being both down W-O-W to $2M (–8%) and $1,613 (–6%), respectively, 90 (+22%) contracts were signed this week, lifting total dollar volume from $161M to $181M.
Although the $4M+ luxury sector could not add another week to its 4-week winning streak, contract volume this week did tie the pre-pandemic average of 8.
Of the 90 contracts signed this week, 41 (+24%) were in Manhattan, 37 (+9%) were in Brooklyn, and 12 (+71%) were in Queens. – Market Proof
Manhattan Reports 41 Contracts Totaling $119M
Although average PPSF and average price were both lower this week to $2,038 (–5%) and $2.9M (–10%), respectively, 41 contracts were signed, a 24% increase over last week and enough to push total dollar volume from $106M to $119M. – Market Proof

