Manhattan Market Report for the week ending March 24th, 2023, Supply closed out at 6,465 and trended upward. Pending Sales at 2,475 and off-market listings (delisting) maintain the market pulse at a .38% level. The market’s liquidity is trending upward.
The Report
Additionally, “With affluent individuals from overseas stepping back into the game to purchase their dream property, the Coldwell Banker Global Luxury program fielded a new survey to explore the trends and attitudes of the wealthy international consumer. Polling more than 1,200 high-net-worth consumers from 12 countries on their dreams and sentiments of buying U.S. real estate, paired with our annual luxury real estate outlook.”
Furthermore, “The number of global millionaires is at its highest point in history. By 2026, it is estimated that the number of millionaires worldwide will surge by 40%, and one in seven adults will have a net worth of at least $1 million”; “The Report.”
Mortgage Rates
Economic uncertainty continues to bring mortgage rates down. Over the last several weeks, declining rates have brought borrowers back to the market but, as the spring homebuying season gets underway, low inventory remains a crucial challenge for prospective buyers. – Freddie Mac (March 30, 2023)
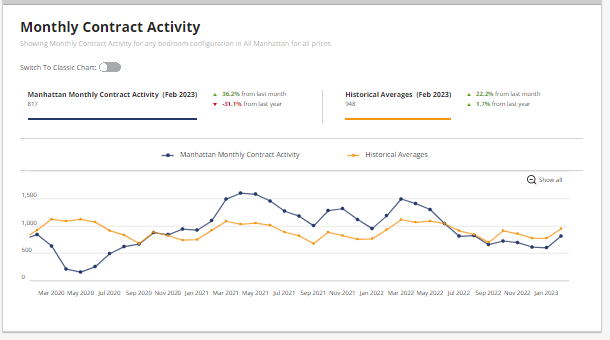
Monthly Contract Activity
Monthly Contract Activity resides at 817 (blue bar). Slightly below the historical average of 948 (gold bar) and is in a range-bound market path. Contracts Signed activity has picked up and is visible in the graph below, showing the blue bar spiking upward.

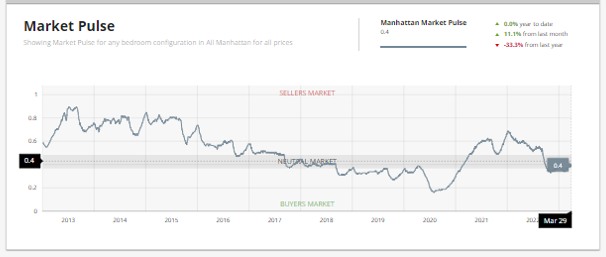
Market Pulse
The market pulse measures the ratio of supply and demand seems to continue to evidence the beginning of the buy-side leverage peaking. The market pulse is residing in Neutral Territory – .4%. In the UrbanDigs Market Pulse, the Manhattan Pending Sales to Supply ratio is .4% (Leverage is going toward the sell side). 2,676 Contacts are waiting to close. In Manhattan, price discovery takes 4-6 months.
The weekly supply has spiked upward and resides at “458”. The weekly contract signed has risen and resides at “262”. Off Market is lower than recently and stands at 130 listings. We are out of the low liquidity zone and shifting to the neutral zone as we enter the busy spring season. There are micro markets in Manhattan in the Seller Zone. NOTE this is not price volume. This is deal volume showing that sellers are receiving bids.

New Development
“Two weeks have passed since bank failures dominated the headlines – ample time for buyers to digest the bad news – and NYC’s new dev market continues to post big numbers. This week, 74 contracts were signed, compared to the pre-pandemic 2015-2019 average* of 53, and the 9-week winning streak has now expanded to the luxury sector.”
– Kael Goodman, co-founder, and CEO
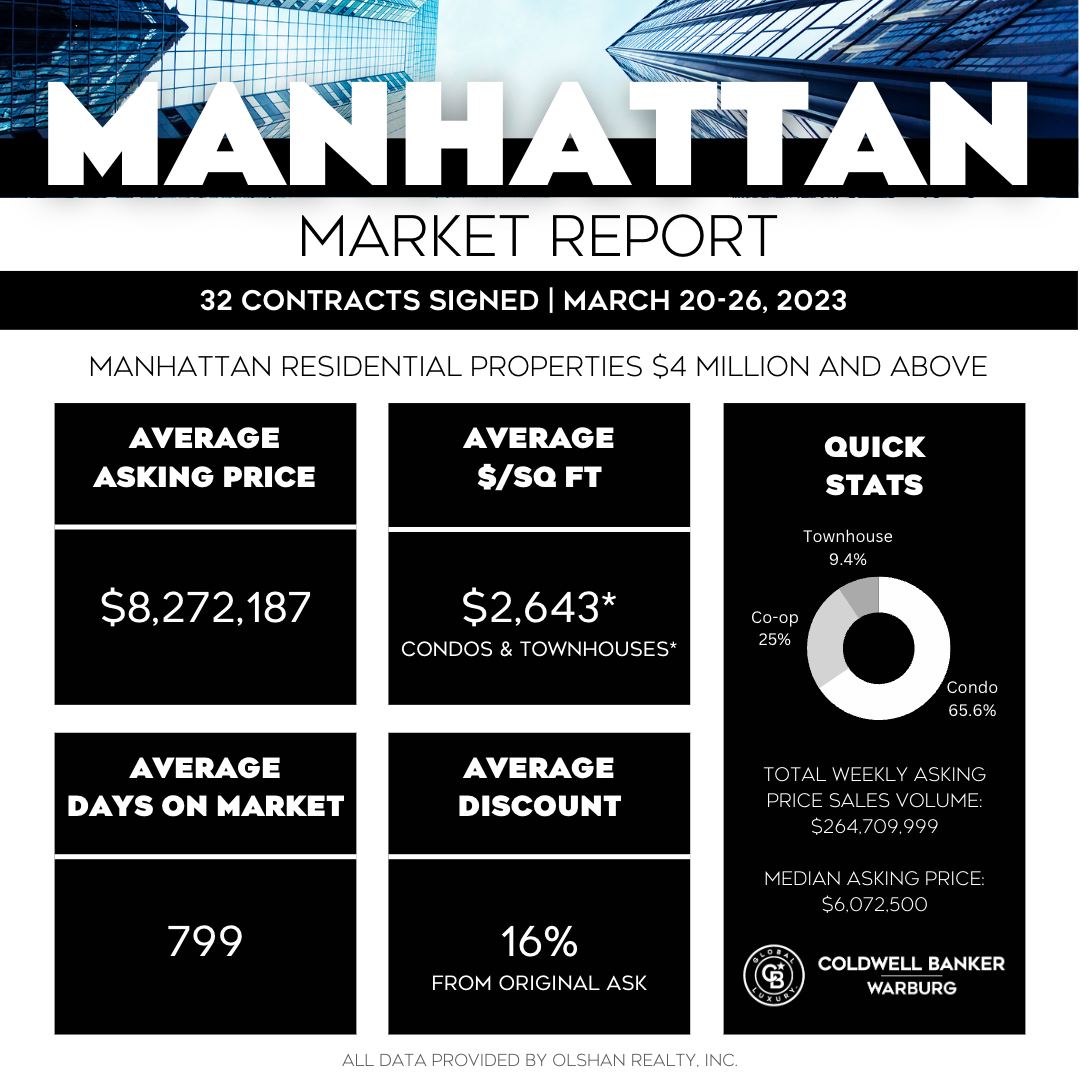
Thirty-two contracts (“32”) were signed on listing $4 million and up for March 20-26th, 2023 – 4 more than the previous week. According to the Olshan statistics, with this current week (the last week of Q1) still to be accounted for, the total of 313 contracts signed to date in Q1 2023, while far below last year’s record-breaking total of 416 signed contracts, is in keeping with the general average for the same quarter for the more than 15 years.
We all know that Q4-2022 was very, very slow in terms of activity for many. So, if the first quarter has gone from slow to “average” – with the increase in weekly contracts over the past six weeks and the overall results for Q1-2023 – I’ll take “average” as a very positive sign of our market’s continued growth.
Condos 21 | Coops 8 and Townhouses 3
Total Weekly Asking Price Sales Volume: $265,709,999 | Average Asking Price: $8,272,187 | Median Asking price $6,072,00 | Average Discount from Original Ask to Last Asking Price: 16% | Average Days on Market: 799.
Top 3 Signed Contracts
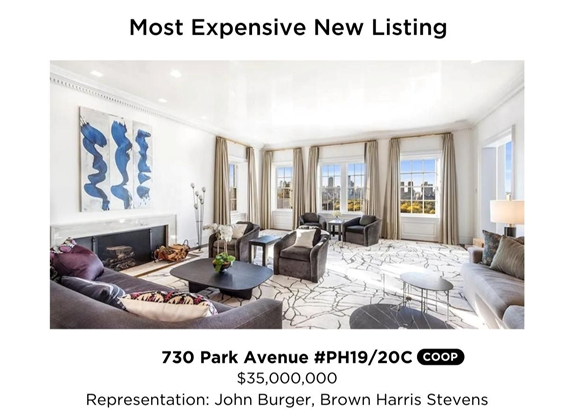
- 17 East 77th Street – Townhouse | Asking $32.5 million |
- 993 Fifth Avenue, PH | Asking $19.95 million
- 1045 Madison, 10th Floor | Asking $15 million


Sponsor Sales
NYC’s 9-Week Winning Streak Expands to Luxury
Last week was exceptional, so all metrics were lower; w-o-w masks the real story. This week’s tally of 74 signed contracts is still 39% more than the pre-pandemic 2015-2019 average of 53. This marks the 9th consecutive week above that historical benchmark. Although the average price dipped 7% to $2.18M, total dollar volume still posted a respectable $161M. The average PPSF decreased slightly from $1,785 to $1,713.
The momentum within the broader market has now expanded to the $4M+ luxury sector. Over the past four weeks, 10, 10, 12, and 12 sponsor contracts have been signed, compared to the pre-pandemic average of 8. This is the first 4-week streak above that historical average from April to May 2022.
Of the 74 contracts signed this week, 33 (–30%) were in Manhattan. Additionally, 34 (+6%) were in Brooklyn, and 7 (+75%) were in Queens. This is the first time Brooklyn has recorded more weekly contracts this year than Manhattan.
Manhattan Reports 33 Contracts Totaling $106M
Manhattan contract volume posted a significant W-O-W decline, from 47 to 33; however, this week’s tally is still above the pre-pandemic average of 29. Average price and average PPSF were stable at $3.2M and $2,154, respectively, and total dollar volume decreased from $149M to $106M. – Market Proof
300 West 30 Street is atop the leaderboard for the eighth time since launching sales New Year’s Day this week with four contracts on 1-beds ranging from $990k to $1.085M.
450 Washington, on the leaderboard for the sixth time in the past seven weeks, reported three contracts this week: a 2-bed listed for $2.495M, a pair of 1-beds asking $1.75M, and $1.65M. On sale for only four months, Corcoran Sunshine Marketing Group already has deals on 48 units within this waterfront cooperative conversion.

