Manhattan Market Report for the week ending March 3rd, 2023, Supply closed out at 6,266 and trended upward. Pending Sales at 2,310 and off-market listings (delisting) maintain the market pulse at a .38% level. Demand is ticking higher. Three consecutive upticks in “demand,” and hopefully, it will remain for the spring season. The Manhattan market impressively continues to witness deal volume and liquidity rise. Although the last two week supply has risen above the 400 level, inventory remains at a “slight net deficit.” As quickly supply hits the market, it is absorbed, creating a feeling that supply selection is limited. Also, prices show a slight rebound, and negotiability discounts are fewer. Leverage in most micro markets has slipped from buyers and towards sellers.
Sellers take note of this rise in liquidity and tightness in the supply trend. Seize upon this selling opportunity window. Create buyer urgency by pricing your property correctly. The market truism is that if there is no action on your listing, “it’s either a product problem, a market problem, or a price problem.” “The price problem is the only way to re-adjust to the market when your initial pricing strategy did not deliver” – UrbanDigs.
Buyer’s leverage is beginning to slip away depending on the micro market you see to purchase in. Supply is tight, and buyer competition for well-priced units is rising with warmer and longer days in the spring season.
Mortgage Rates Continue to Climb Up
“As we started the year, the 30-year fixed-rate mortgage decreased with expectations of lower economic growth, inflation, and a loosening monetary policy. However, given sustained economic growth and continued inflation, mortgage rates boomeranged and are increasing to seven percent. Lower mortgage rates back in January brought buyers back into the market. Now that rates are rising, affordability is hindered, making it difficult for potential buyers to act, particularly for repeat buyers with existing mortgages at less than half of current rates.” – Freddie Mac.

Monthly Contract Activity
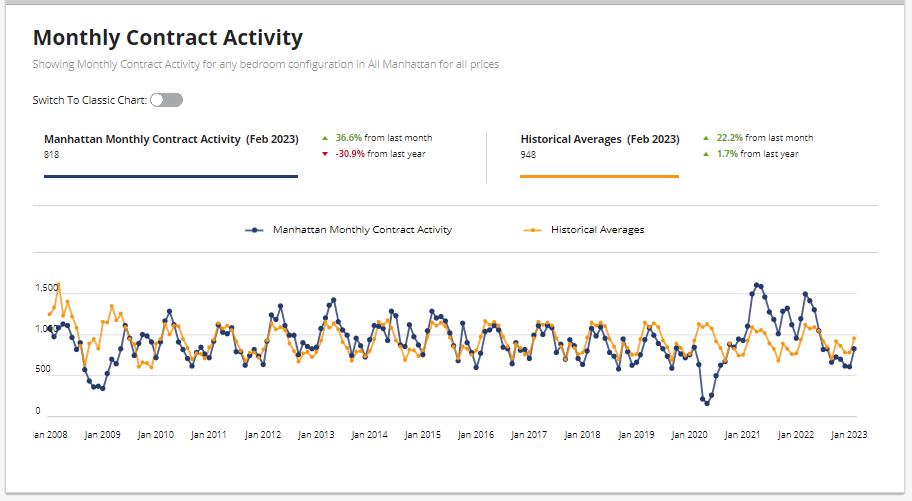
Monthly Contract Activity resides at 818 (blue bar). Slightly below the historical average of 948 (gold bar) and is in a range-bound market path. Contracts Signed activity has picked up and is visible in the graph below, showing the blue bar spiking upward.

Market Pulse
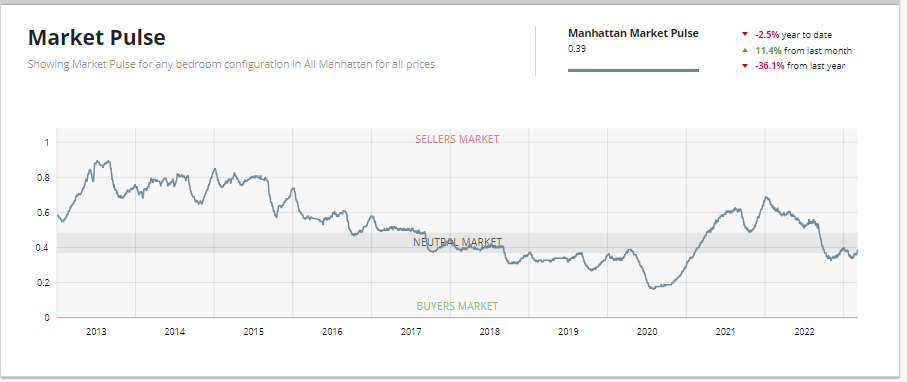
The market pulse measures the ratio of supply and demand seems to continue to evidence the beginning of the buy-side leverage peaking. The weekly supply has spiked upward and resides at “429”. The weekly contract signed has risen and resides at “233”. Off Market is lower than recently and stands at 191 listings. We are out of the low liquidity zone and shifting to the neutral zone as we enter the busy spring season. There are micro markets in Manhattan in the Seller Zone. NOTE this is not price volume. This is deal volume showing that sellers are receiving bids.

Luxury Properties
“Despite mortgage rates being 50% higher today. Demand for new development during the first two months of 2023 was 2%. Above the average January and February period during the pre-pandemic years 2015-2019*. However, we expect that spread to widen by the end of this quarter because the city just recorded its 6th straight week of above-average contract volume.”
– Kael Goodman, co-founder, and CEO
*used as a normalized benchmark for comparison as it is the most recent period unaffected by the COVID pandemic.
Thirty-One (“31”) contracts were signed last week for properties asking $4 million and up – eight “8” more than the previous week and the 2nd time this year that 30 or more contracts were signed. Donna Olshan has some interesting observations about “negotiability” – the difference between the original asking price and the current/last asking price – previous week, listings with signed contracts were asking 12%, on average, below the original asking price. Year to date, that number is around 8%. Condos outsold coops, 19-10 | 1 condop and one townhouse.
Top Listings: 1) The Park Imperial: 230 West 56th Street Unit 64THFLoor—Asking $14,500,000 | 2) 50 West 66th Street, Unit3D– Asking $12,025,000 and 3) 126 East 70th Street Townhouse – Asking $11,500,000 and 4) 12 East 12th Street – Unit 10 – Asking 11,250,000.
Total Weekly Asking Price Sales Volume: $228,583,000 | Average Asking Price: $7,373,645 | Median Asking Price: $6470,000 | Average Discount from Original Ask to Last Asking Price: 12% | Average Days on Market: 495

