Manhattan Market Report for the week ending December 16th, Supply closed out at 6,524 and trending downward as we close out the year. Pending Sales at 2,483 and off-market listings (delisting) maintain the market pulse at a .38% level. Manhattan is holding on to price action due to the resilient rental market. low supply in the sales market, and sellers choosing to rent or remove the listing from the market.
The New York City Comptroller highlights employment grew and inflation moderated slightly last month – “a nice way to head into the holidays. Office occupancy and commuting numbers have held steady for several months, suggesting that we may be settling into a new normal. However, layoffs at several tech companies, declining Wall Street bonuses, and rising interest rates continue to portend challenges in the year ahead.”
The City’s infrastructure improvements (parks, libraries, water, sewer, transportation, hospitals, housing, and technology) are crucial for the livability of its residents now and in the future. The vast majority of the funding for infrastructure comes from the City of New York’s debt financing. The City’s low debt burden is due to low-interest rates from the past, and increased tax revues from property values that grew faster than capital expenditures. The City’s debt burden is at its lowest level in the past 20 years. After reaching a high of 17.2% in FY 2002, the City’s debt service as a percent of local tax revenues has dropped to 9.7% in FY 2022.
Mortgage Rates
This week, mortgage rates dropped for the fifth week in a row.
Primary Mortgage Market Survey® (PMMS®), showing the 30-year fixed-rate mortgage (FRM) averaged 6.31 percent.
Furthermore, “Mortgage rates continued their downward trajectory this week, as softer inflation data and a modest shift in the Federal Reserve’s monetary policy reverberated through the economy,” said Sam Khater, Freddie Mac’s Chief Economist. “The good news for the housing market is that recent declines in rates have led to a stabilization in purchase demand. The bad news is that demand remains very weak in the face of affordability hurdles that are still quite high.”
News Facts
- The 30-year fixed-rate mortgage averaged 6.31 percent as of December 15, 2022, down from last week when it averaged 6.33 percent. A year ago at this time, the 30-year FRM averaged 3.12 percent.
- The 15-year fixed-rate mortgage averaged 5.54 percent, down from last week when it averaged 5.67 percent. A year ago at this time, the 15-year FRM averaged 2.34 percent
Related Article: Take Advantage of Mortgage Rates While You Can by Brian Klein
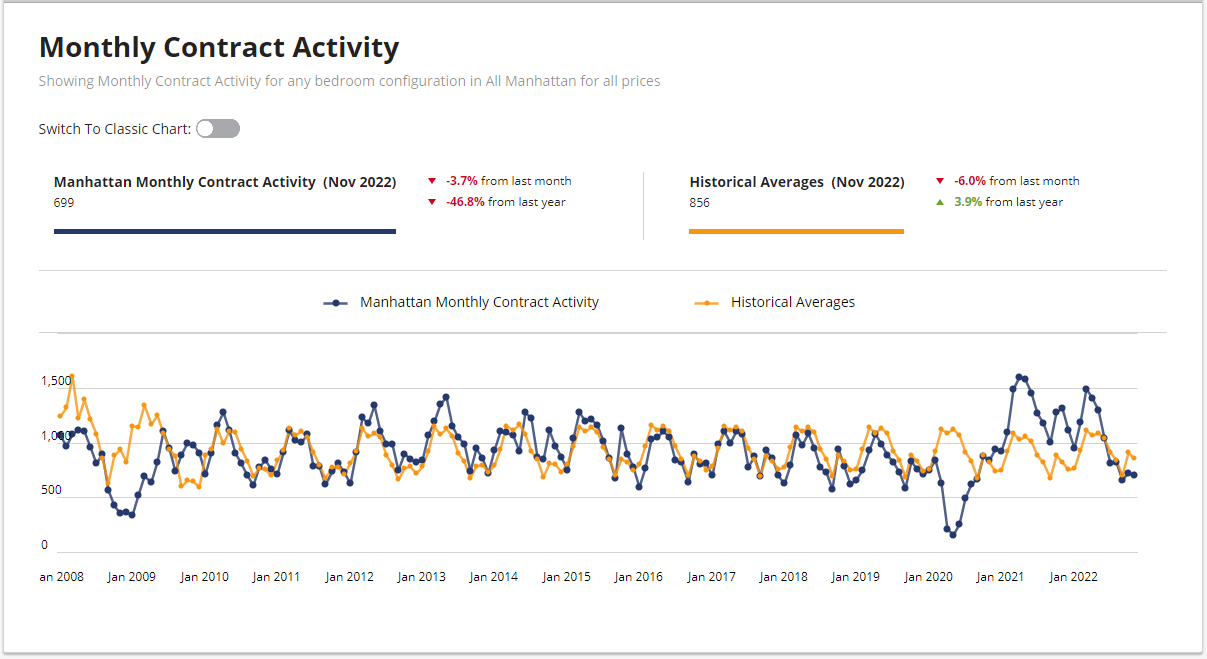
Manhattan Monthly Contract Activity
Monthly Contract Activity resides at 856 (blue bar) trends below the historical averages (gold bar) and are in a range-bound market path. This path is classified as horizontal, ranging, or sideways bound between a high and low range. The monthly Contract Activity range is dependent on “rate volatility, the Fed, risk assets, credit spread, and other macro indicators”.
Manhattan Market Pulse
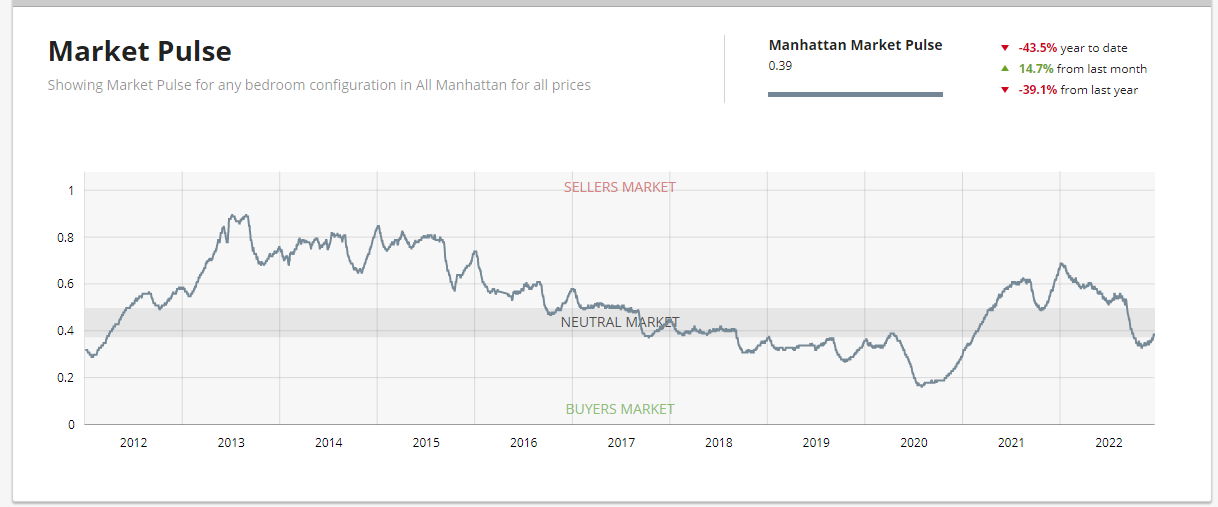
The market pulse measures the supply and demand ratio seems to continue to evidence the beginning of the buy-side leverage peaking. UrbanDigs reports, “a bottom formation tends to occur when a decelerating market starts to show signs of a positive turnaround. This reshapes the downward slope to a flatter one and sometimes, but not always, precedes a period of recovery.
The weekly supply, as seasonally expected, is down and stands at 103. The weekly contract signed is down too and stands at “174”. Off Market is 222 listings. Market Pulse resides at .38%.
Luxury Market
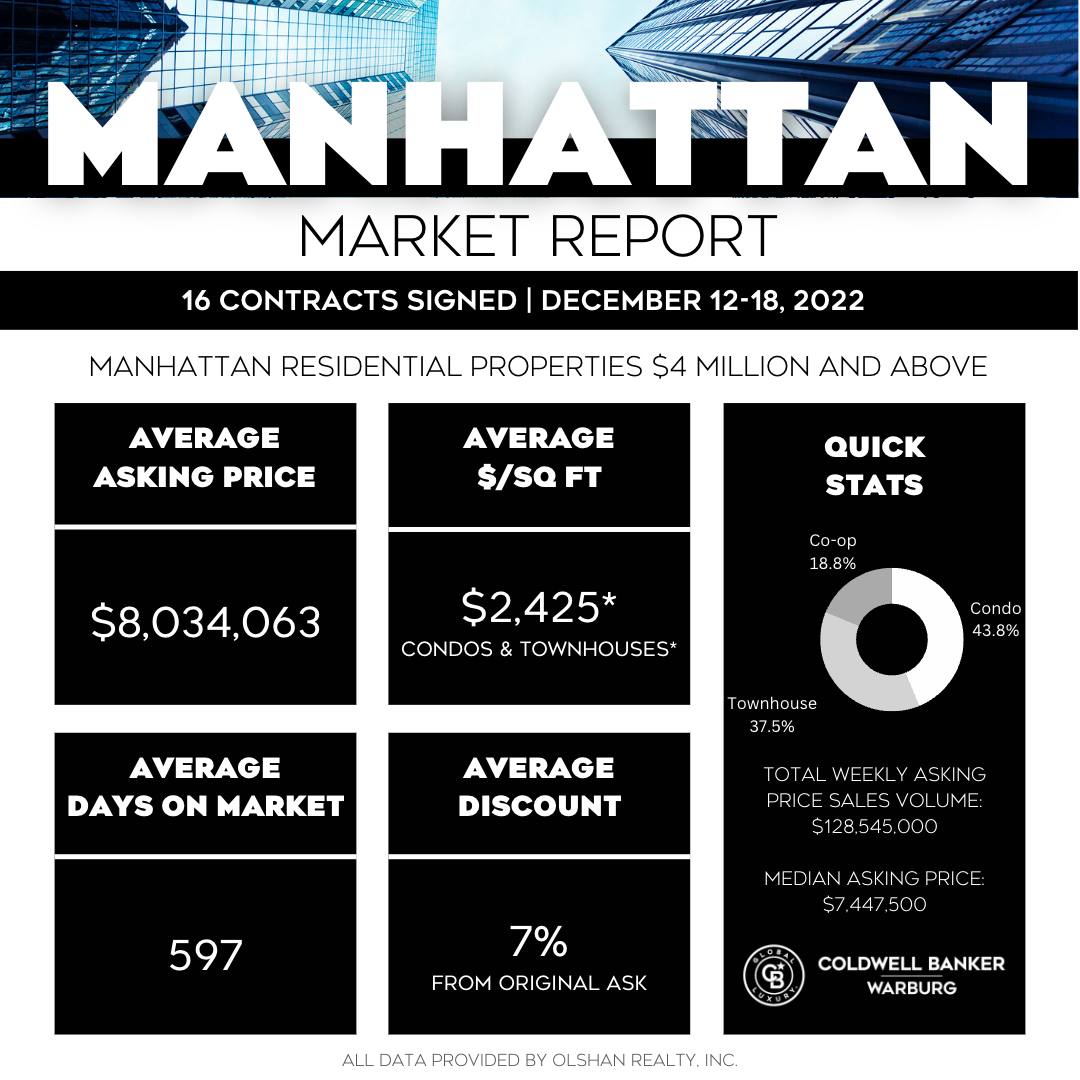
“The last full week before the holidays saw steady deal flow that heavily favors less expensive product, sending the luxury market to one of its lowest weekly tallies of the year.” Kael Goodman, CEO of Market Proof
Sixteen contracts were signed last week at $4 million and above in Manhattan Market, 5 fewer than the previous week. Condos outsold coops, 7-3, while the townhouse market continued its robust performance adding 6 contracts to the mix. In the last 4 weeks, townhouses have outsold coops, 13-7.
Top Contracts
The No. 1 contract was PHAB at 605 Park Avenue, asking $15 million, reduced from $17. Million when it was listed a year ago. The monthly maintenance is $22,047. This post-war, triplex coop has 5 bedrooms, 3 bathrooms, and powder rooms. The bottom floor includes a 31-foot living room, formal dining room, master bedroom, 2 other bedrooms, and a gym; all surrounded by a terrace. The 2nd floor has a den with a wet bar and other rooms. Amenities include a doorperson, resident manager, gym, and storage and the top floor features a solarium.
One of my favorite buildings was the No.2 contract at 100 Barclay PHB a.k.a. 31A asking $13.45 million. The condo has 4,311 square feet including 5 bedrooms, 5.5 bathrooms, and a wraparound terrace totaling 1,023 square feet. The unit features a 23’ x 36’ great room and 10-foot ceilings. The seller paid $11,193,750 in June 2017. The building has over 40,000 square feet of amenities including door person, concierge, fitness, pool, roof deck media room children’s playroom, music room, bike room, storage, and wine lockers.
Total Weekly Asking Price Sales Volume: $128,545,000 | Average Asking Price: $8,034,063 | Median Asking Price: $7,447,500 | Average Discount from Original Ask to last Asking Price: 7% | Average Days on Market: 597
Manhattan Market’s Luxury Report Year-End Summary
Olshan’s Manhattan Year-End Report for 2022 for contracts signed in 2022 for listings asking $4 million and above. There is a lot of information here with breakdowns by year, neighborhood, by apartment type, etc. All told, through this past week, there were 1,304 contracts signed asking $4 million and up, totaling over $10 billion in residential real estate. It’s interesting to see that 65% (836 deals) were signed in the first half of the year, and almost half that number (468) was signed in the second half of the year – exactly what we’ve been experiencing when the market “turned” sometime around April/May.
It’s also interesting to note that the number for 2022 is much closer to the results for the years 2013 thru 2019 highlighting the fact that 2020 was a Covid-related outlier in terms of low sales, and 2021 was a rebound year but also an outlier.
Rental Market
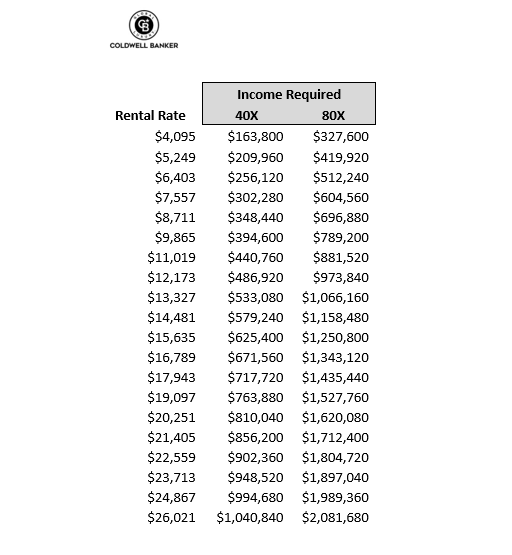
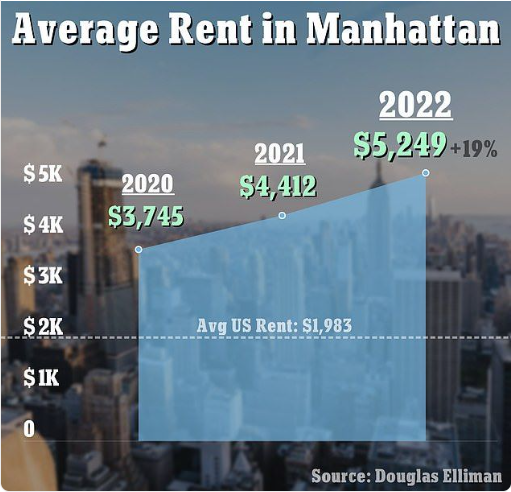
Average Manhattan Market rent rocketed to $5,249 in November – up 19% in a year. Landlords require Renters to have an income 40 times the rent and Guarantors 80 times the rent. That means Renters for a median rental rate of $4,095 would need to demonstrate that they bring home a gross salary of at least $163,800 or have a guarantor with a gross salary of at least $327,600. The below chart provides a snapshot of the gross income required for renters and guarantors at various rental price points.
Thank You
I am ever so grateful for the growing number of people choosing and recommending Coldwell Banker Warburg as their number-one team. Selling luxury real estate is an art form and a craft. It’s the reason why Coldwell Banker is trusted with over $270 million in luxury sales every single day. *
A new year brings new beginnings and fresh energy. As I begin to prepare for 2023, I would like to hear from you. I am eager to learn what I can do for you to make it possible for you to have the life you have always envisioned for yourself.
There are opportunities in the market, and we can make the future brighter in 2023.
Curious to find out your buying or selling power in this market contact me to discuss your plans. Book a call by connecting with me on my website to discuss plans to buy or sell in New York City. I look forward to hearing from you!
Connect With Me

Karen’s extensive background in real estate financial markets empowers her to not only understand the economic aspects of a home sale or purchase but the emotional components that can hinder a transaction from closing quickly and seamlessly. A dual-licensed salesperson in New York with Coldwell Banker Warburg and in New Jersey with Elite Realtors. She represents a variety of property types, including new developments, co-ops, townhomes, and condos.
Other educational articles about the market and your home search are under Karen’s Blog.
*Data based on closed and recorded buyer and/or seller transaction sides of homes sold for $1 Million or more. As reported by Coldwell Banker numbers are based on Coldwell Banker’s financial data as of 9/30/2021. Total volume is calculated by multiplying the number of buyers and/or seller sides by the sales price.

