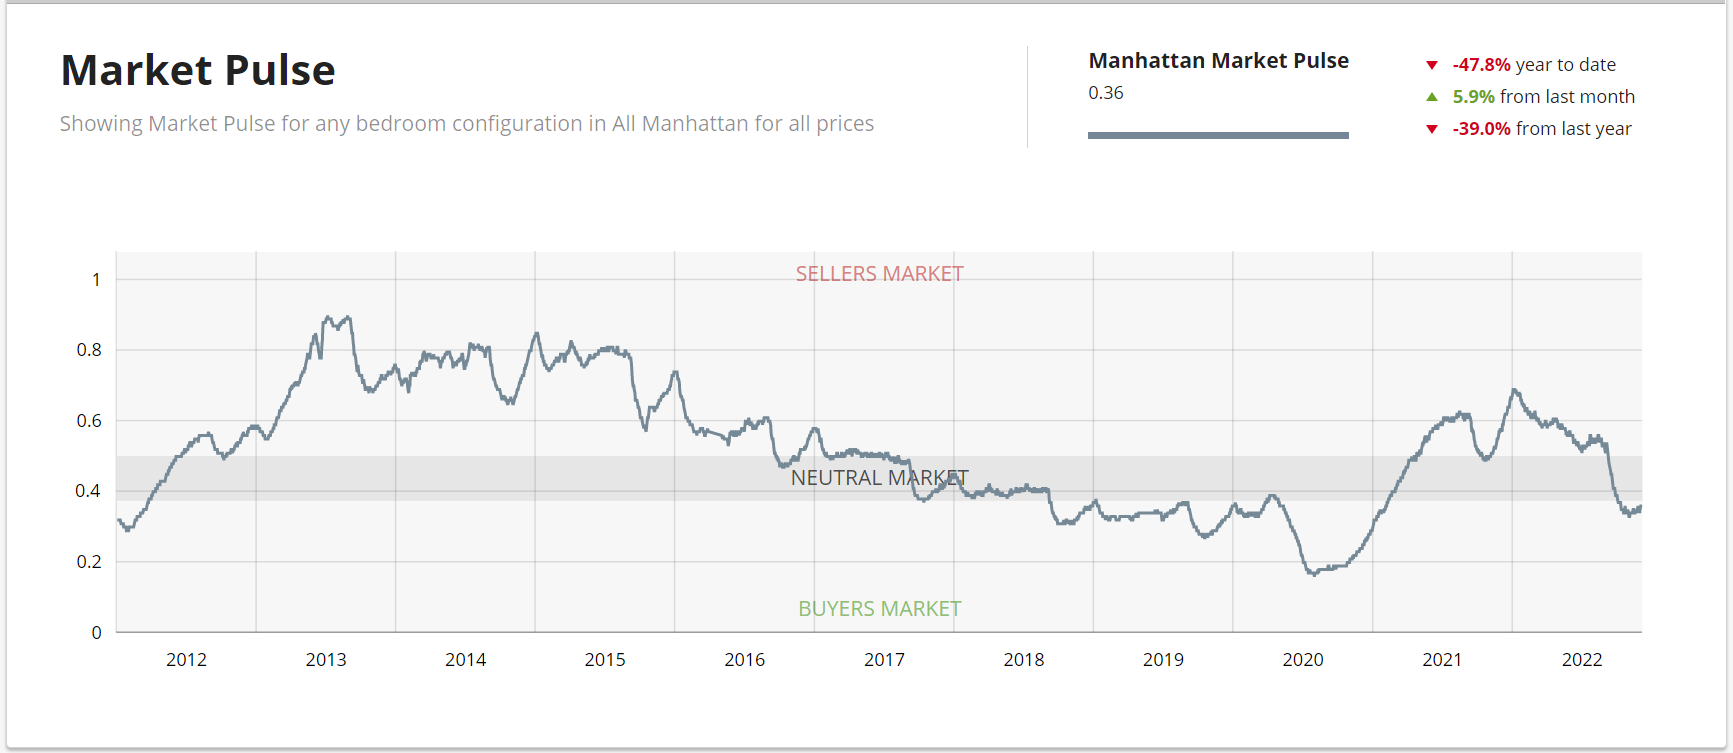
Manhattan Market Report for the week ending December 2nd, Supply closed out at 7,022. Pending Sales at 2,511 and off-market listings maintain the market pulse at a .36% level.
Market Pulse
The market pulse measures the ratio of supply and demand seems to continue to evidence the beginning of the buy-side leverage peaking. UrbanDigs reports “a bottom formation tends to occur when a decelerating market starts to show signs of a positive
turnaround. This reshapes the downward slope to a flatter one, and sometimes, but not always, precedes a period of recovery. The bottom formation is circled in the chart below, as well as the Covid bottom signal and arrows of past signals.”
The weekly supply as seasonally expected is down and stands at 215. The weekly contract signed is down too and stands at “126”. Off Market is 290 listings. Market Pulse resides at .36.
Mortgage Rates Continue to Decrease
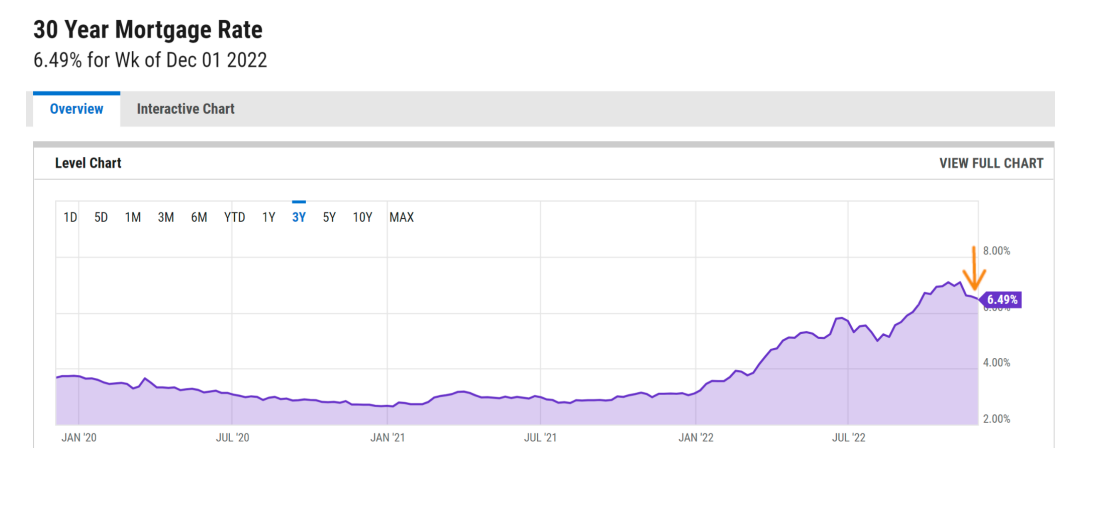
Mortgage rates “continue to drop this week as optimism grows around the prospect that the Federal Reserve will slow its pace of rate hikes. Even as rates decrease and house prices soften, economic uncertainty continues to limit homebuyer demand as we enter the last month of the year.”
 Monthly Contract Activity
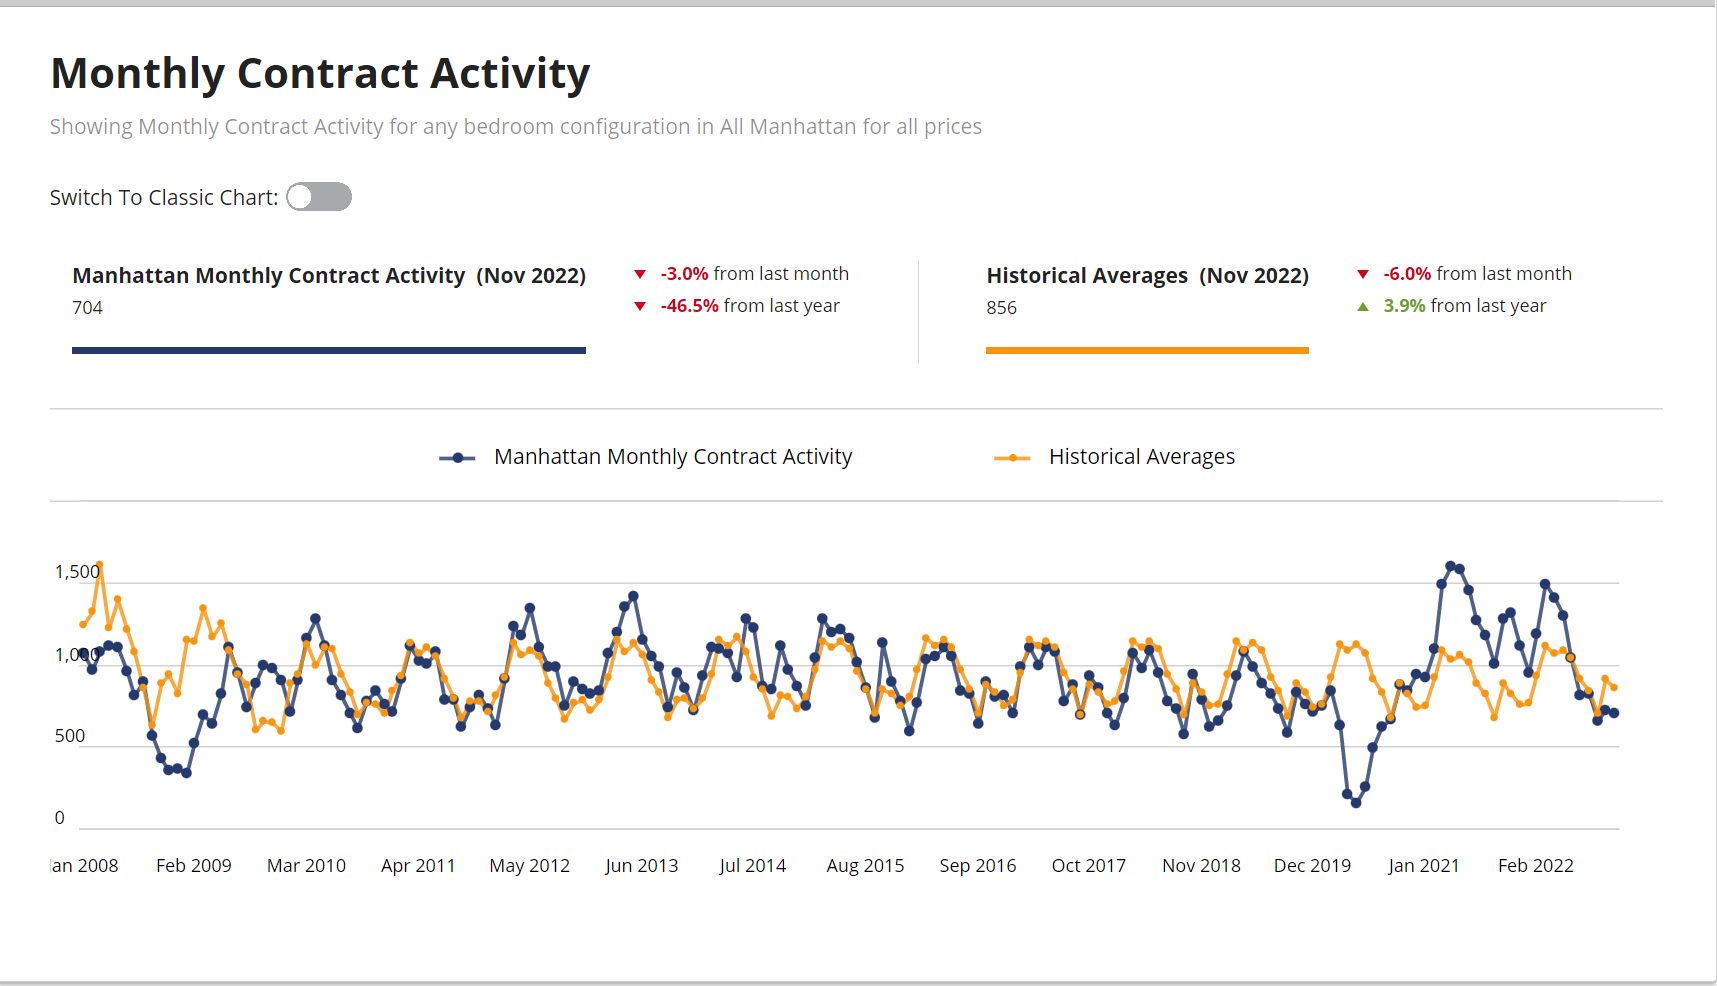
Monthly Contract Activity resides at 704 (blue bar) trends below the historical averages (gold bar) and are in a range-bound market path. This path is classified as horizontal, ranging, or sideways bound between a high and low range. The monthly Contract Activity range is dependent on “rate volatility, the Fed, risk assets, credit spread, and other macro indicators”.
Condo/Coop Price Per Square Foot
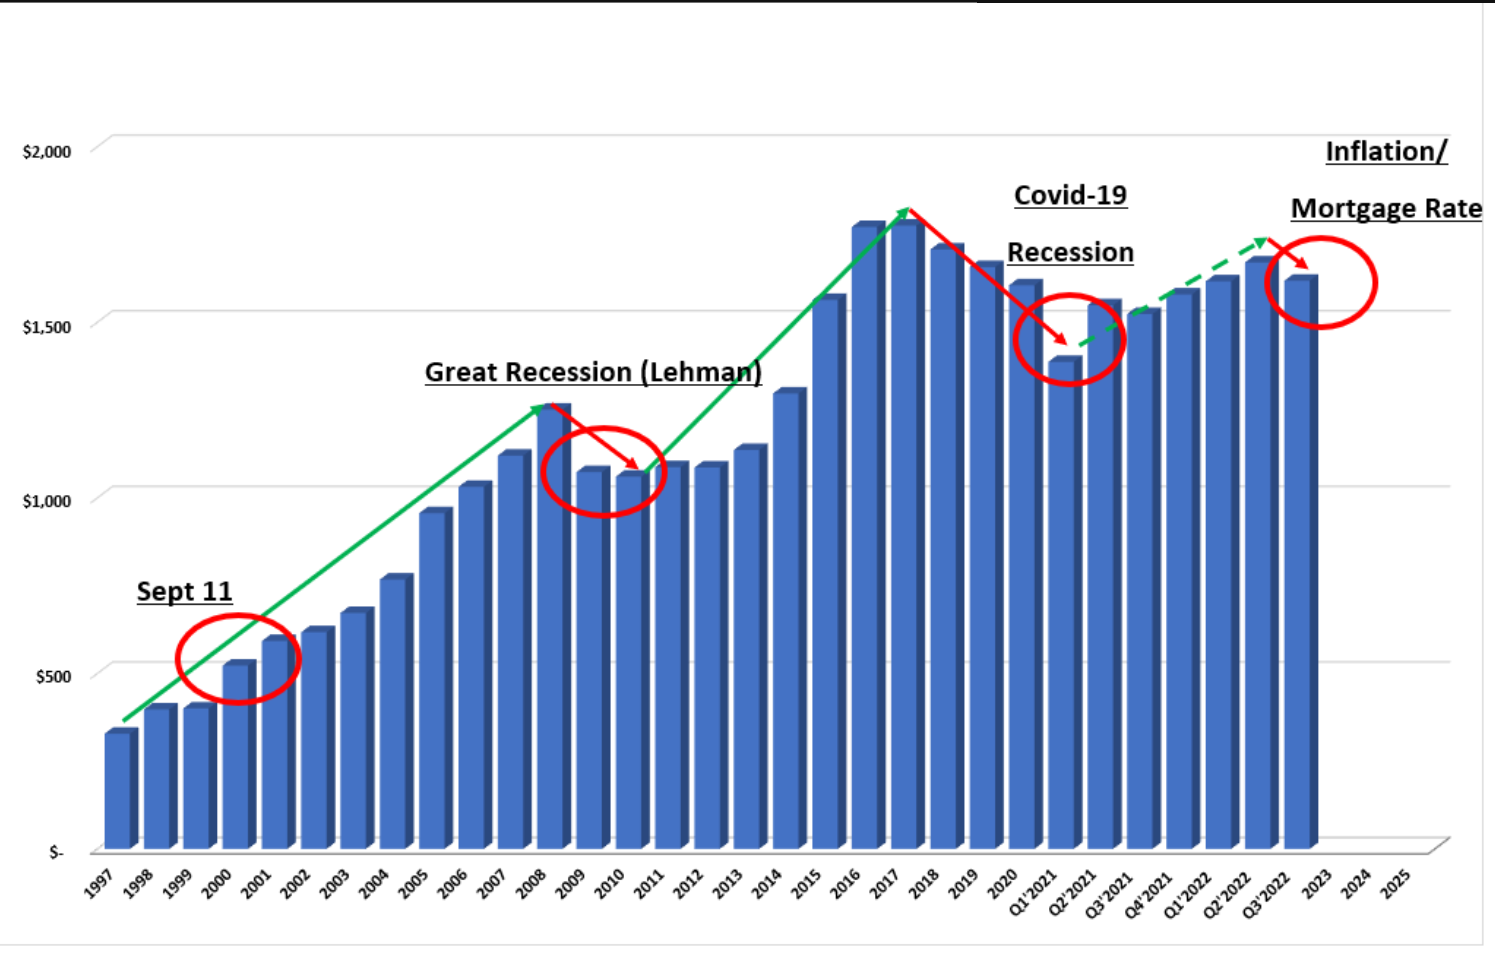
The average price per square foot of a Manhattan condominium in Q3’2022 was $2,080, representing a significant premium over the condo/coop average of $1,618 shown in the graph below.
Sponsor Sales
Sponsor contracts week ending December 4th, increasing from 34 to 48 (+41%) from the week prior. Deals were reported across 40 buildings and totaled $177,356,585 (+82%). The average price increased to $3,694,928 (+29%) and the average PPSF was essentially consistent at $1,855 (+2%).
The luxury tier saw a small decline with 6 new deals above $4M.
Manhattan had 27 contracts (+29%), Brooklyn had 18 (+50%), and Queens had 3 (+200%).
Impact of Price on Visibility
Sellers the market is not as liquid as it was at the beginning of 2022. Inventory is lower, and there is less market demand due to interest rate volatility and other markets’ economic uncertainties. The wider bid-ask spreads are impacting the age of listings on the market.
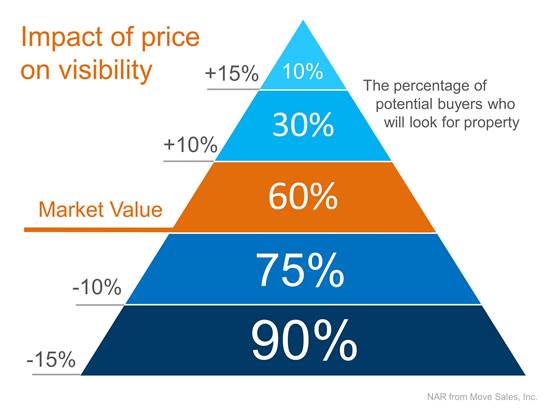
Although counterintuitive, strategically pricing a home a little lower than market value rather than higher generates a higher sales price. Sellers often choose to list their homes a little OVER market value to leave room for negotiation. This strategy actually dramatically decreases the number of buyers who will see their listing! (see the chart below)
Additionally, pricing a home at the high end of the value will generally cause the home to sit and accrue market time. This is especially true in today’s market. Instead of the seller trying to ‘win’ the negotiation with one buyer, they should price their house so that demand for the home is maximized upon listing the property. By doing so, the seller will not be negotiating with a buyer over the price, but will instead have buyers compete for the home.
The most effective way to sell your home fast is to price the home competitively based on the active comps in the market. Listings that go into contract within 30 days have little to no price discount and the longer a listing remains in the market the larger the price discount. The percentage of potential buyers who will look for your property is greatly impacted by the listing price compared to its actual Market Value. The price is too high, and it might cost you by a longer time on the market and resulting in possible multiple price drops. If the price is too low, you could lose out money by leaving too much behind.
Fed Normalizes the Market
The markets expect the U.S. Federal Reserve (Fed) to raise rates by 0.5 percentage points at its next meeting on Wednesday, December 14 The Fed stresses its commitment to fighting inflation, but now rates are increasing closer to where officials want them to be. In addition to the Fed normalizing the overall market. The market pulse demonstrates a bottom formation this may be a buyer’s opportunity. Key market facts evidenced by the data: 1) supply is falling, 2) pending sales are showing signs of nearing a bottom formation, 3) the market pulse is showing a bottom formation, 4) mortgage rates have fallen, and 5) the latest mixed price action data is, at the very least, is suggesting we are no longer in active decline.

